Can I compare and visualize results from multiple experiments in DYNAMICS?

Introduction
With EASI Overlay in DYNAMICS®, data from separate experiments and even different Wyatt DLS instruments such as the DynaPro® NanoStar®, Mobius™, and DynaPro Plate Reader can be overlaid to streamline comparisons. After the desired experiments have been opened in the DYNAMICS software, you can easily choose which measurements to include in EASI Overlay while utilizing all of the same graphing features available outside of EASI Overlay. This enables rapid and effortless juxtaposition of experiments, including experiments conducted at vastly different times for stability monitoring or by different instruments and users for performance qualification and verification.
How to access EASI Overlay
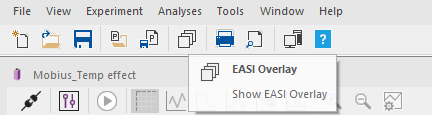
After opening the desired experiment files in DYNAMICS, left-click on the icon to the left of the Print icon in the Toolbar (View -> Toolbar if the Toolbar is hidden from view). At least one file must be open to access EASI Overlay, then additional experiment files can be opened subsequently for plotting.
Collective analysis of data from different experiments
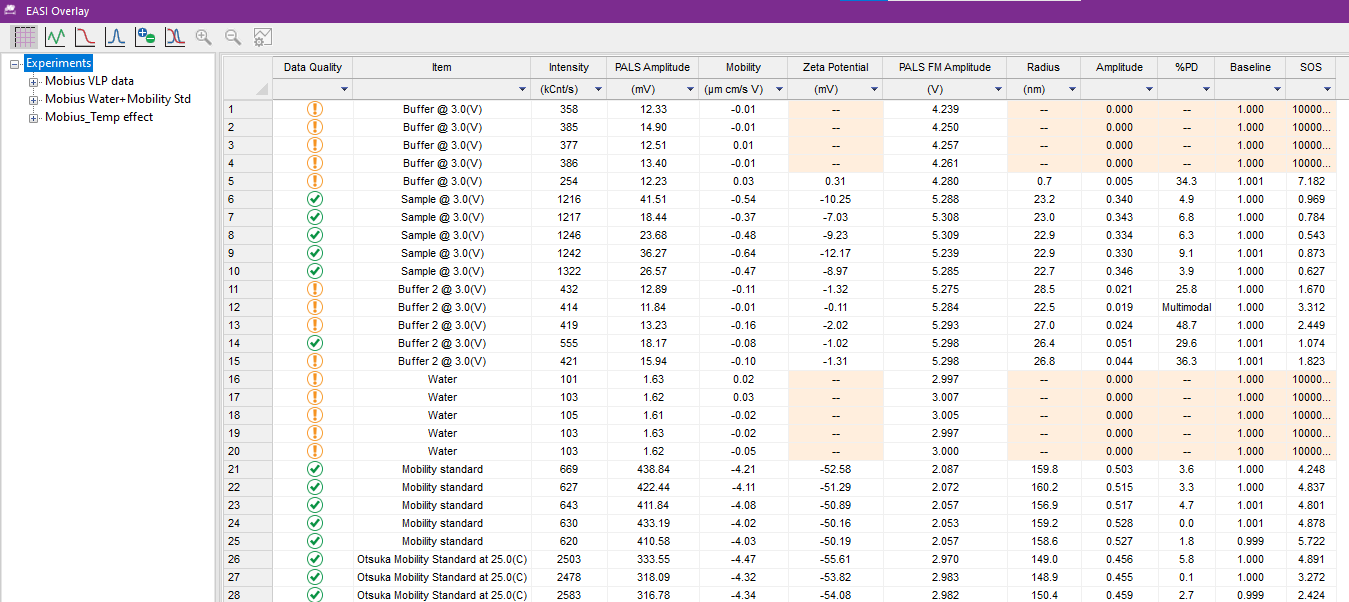
Once EASI Overlay is open, you can view your experiments and their individual measurements in the left panel. EASI Overlay will automatically display the Datalog Grid for the chosen experiments. If Experiments is selected in the left panel, you can see a compiled list of all of the data from all imported experiments. All of the same features available in Datalog Grid outside of EASI Overlay can now be applied to your larger set of experiments. This includes filtering, sorting, and marking of data to facilitate analysis.
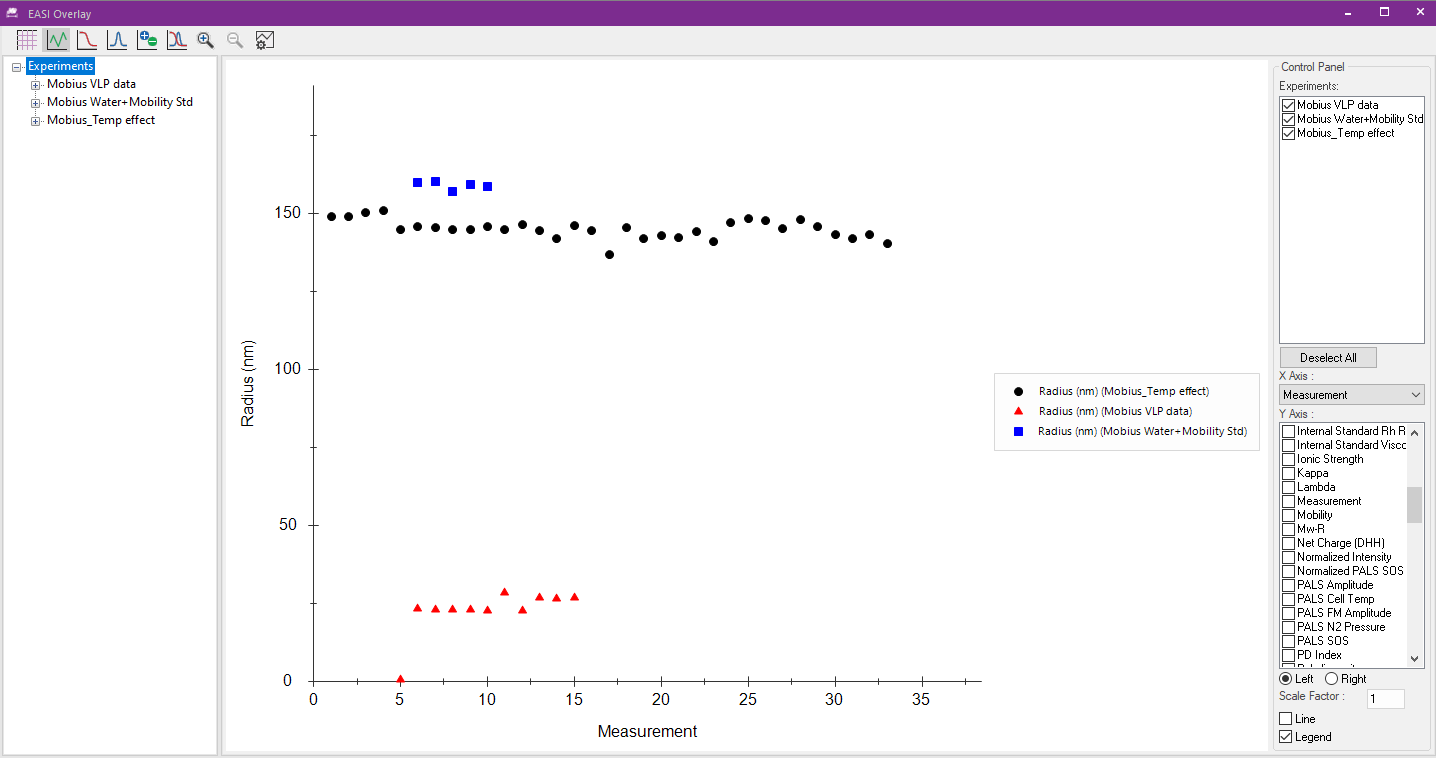
You can navigate to various plotting and analysis tools the same way you would outside of EASI Overlay, using the top toolbar. The Datalog Graph can now be used to make custom plots across experiment sets by checking/unchecking the experiment files in the Control Panel on the right.
Choosing measurements to visualize in graphs
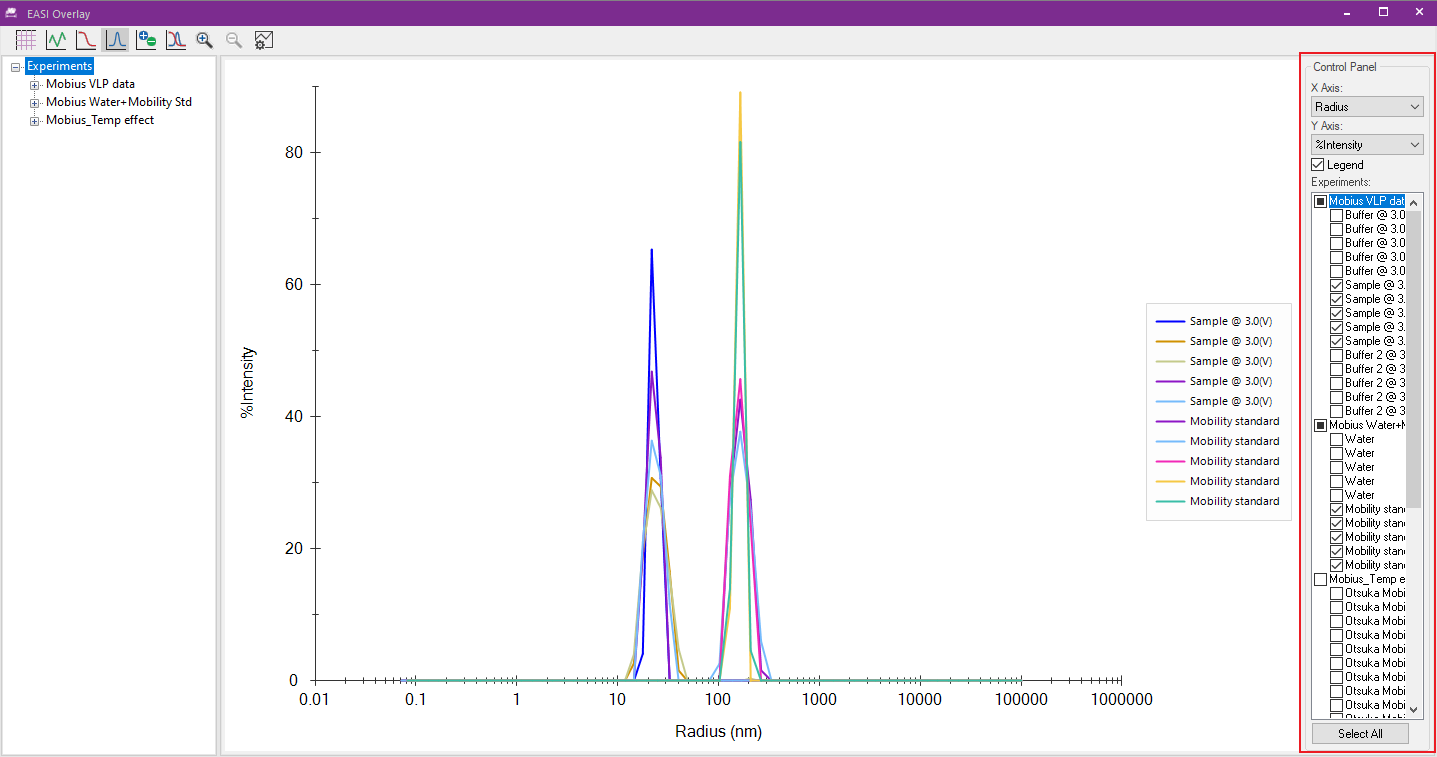
Using the Correlation Graph, Regularization Graph, Mobility Graph, and Regularization Graph and Correlation Graph tools, specific measurements within experiment files can be checked/unchecked to include/exclude them in your plot. This gives the ability to massively compare numerous measurements side-by-side or make specific comparisons between just a few measurements. Plots of the combined data sets can then be exported while the original files remain unchanged.
Conclusion
EASI Overlay is only available in DYNAMICS 8.1 and higher. For more details see the DYNAMICS 8 User’s Guide.
Do you have a question? Contact our experts here in Customer Support. We’re happy to help! Call +1 (805) 681-9009 option 4 or email support@wyatt.com.