How can I quickly assess the data quality of my DLS measurements using DYNAMICS?

New in DYNAMICS 8: Automatic Data Quality Assessment
One of the many benefits of dynamic light scattering (DLS) is its capability as a rapid, potentially high-throughput screening tool. You just load your sample, click, and get a radius. However, this means it can be treated like a black box, and users might not be aware of pitfalls in data interpretation. In fact, DLS is extremely sensitive to particulate contamination which can lead to artifacts in the data. Other causes of poor data quality and reproducibility include low concentration, bubbles, detector saturation and insufficient volume. New in DYNAMICS 8.0, automatic data quality assessment offers a way to quickly determine which measurements meet data quality standards and which need to be scrutinized or revisited.

Interpreting Data Quality
DLS data quality can be interpreted by analyzing the autocorrelation function (ACF) and its fit, plus characteristics of static light scattering. Here are some parameters that indicate aspects of data quality:
- ACF baseline – should reach 1.00
- ACF sum of squares (SOS) – for a monomodal sample, this should be under 100
- Count rate – should be between roughly 100 to 1000 kCnts/sec, depending on the instrument
- Intensity fluctuations – an unstable signal often indicates dust contamination or bubbles
But you don’t have to memorize these criteria. The Data Quality algorithm in DYNAMICS examines several characteristics of the ACF and other light scattering indicators to identify any data quality issues. Should the quality not be optimal, it offers suggestions for how to improve the data.
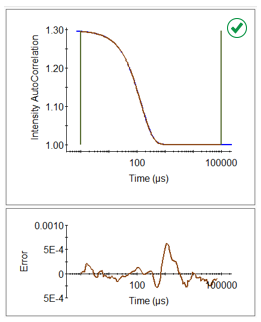
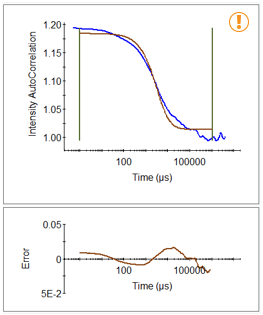
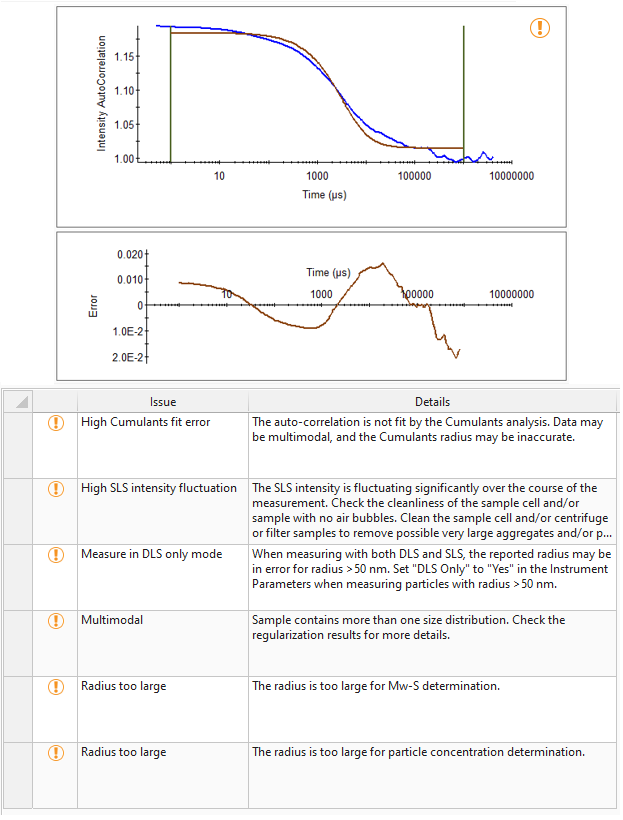
Figure 1. Left - ACF graph indicates good quality data. The fit (brown) overlays the raw data (blue), and the residuals, shown below the ACF graph, are small. Right - ACF graph indicates poor data quality. The residuals are large, and the trace is jagged. Click to enlarge.
DYNAMICS 8 Data Quality Reporting
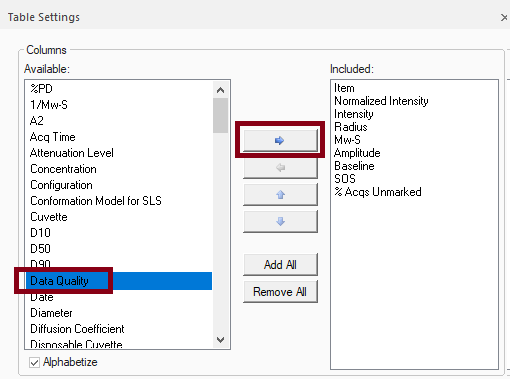
To view the Data Quality result for your experiment, click on the Measurements node, and select the Datalog Grid. Then go to Table Settings (Ctrl-T), select Data Quality, and add it to the grid.
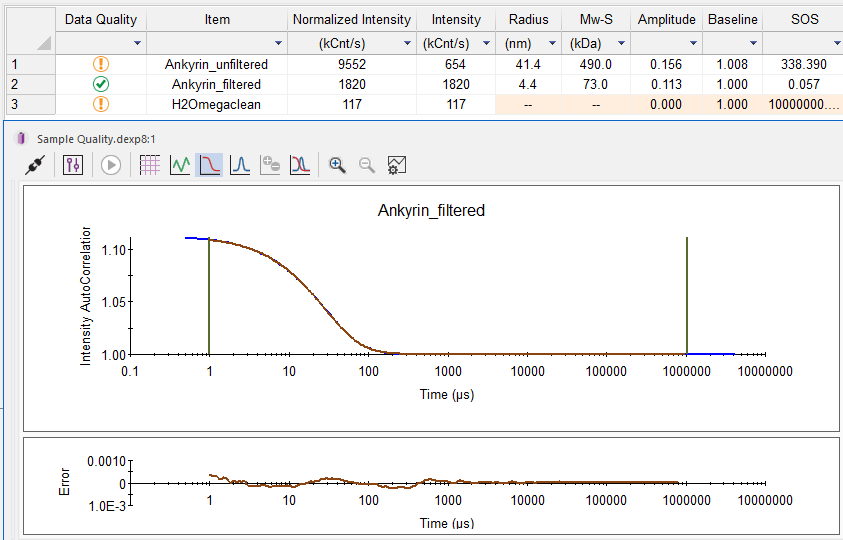
Caution or bad status
For measurements with a ‘Caution’ or ‘Bad’ status, click on the icon to see more details about why the measurement was flagged and possible solutions.
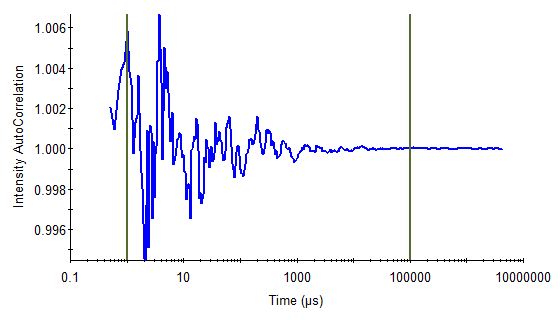
The unfiltered protein sample, whose ACF and data quality results appears in Figure 2, contains large aggregates that were identified according to several criteria used by the data quality algorithm. Filtering the sample will remove the aggregates and lead to an ACF more like the one in Figure 3.
Clean solvent
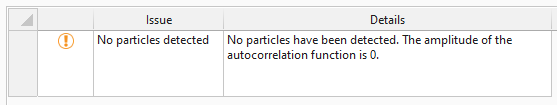
If no particles are detected in a measurement, the quality status will show the caution symbol. But for solvent measurements, that is actually desirable, as it indicates a clean solvent.
Conclusion
The Data Quality Analysis feature, which is only available in DYNAMICS 8.0 and higher, facilitates DLS data interpretation and helps non-experts ensure that their measurements are meaningful and unbiased by artifacts. For more details see the DYNAMICS 8 User’s Guide.
Do you have a question? Contact our experts here in Customer Support. We’re happy to help! Call +1 (805) 681-9009 option 4 or email support@wyatt.com.