How can I use the Bubble Detection feature in DYNAMICS to quickly screen DynaPro Plate Reader data?

Introduction
The bubble detection feature—available beginning with DYNAMICS® version 8.2—is a machine learning algorithm that uses the camera in your DynaPro® Plate Reader to automatically detect air bubbles in samples. This provides rapid identification of samples that are producing erroneous DLS data as a result of the bubbles, so that those samples may be ignored and overall data quality from the plate will be enhanced. You can then inspect the images of the wells to further understand the type or cause of the bubbles and possibly eliminate them. To use bubble detection, you must have the camera enabled in your experiment, and you must be using a 384 well plate.
Navigating the Bubble Detection feature
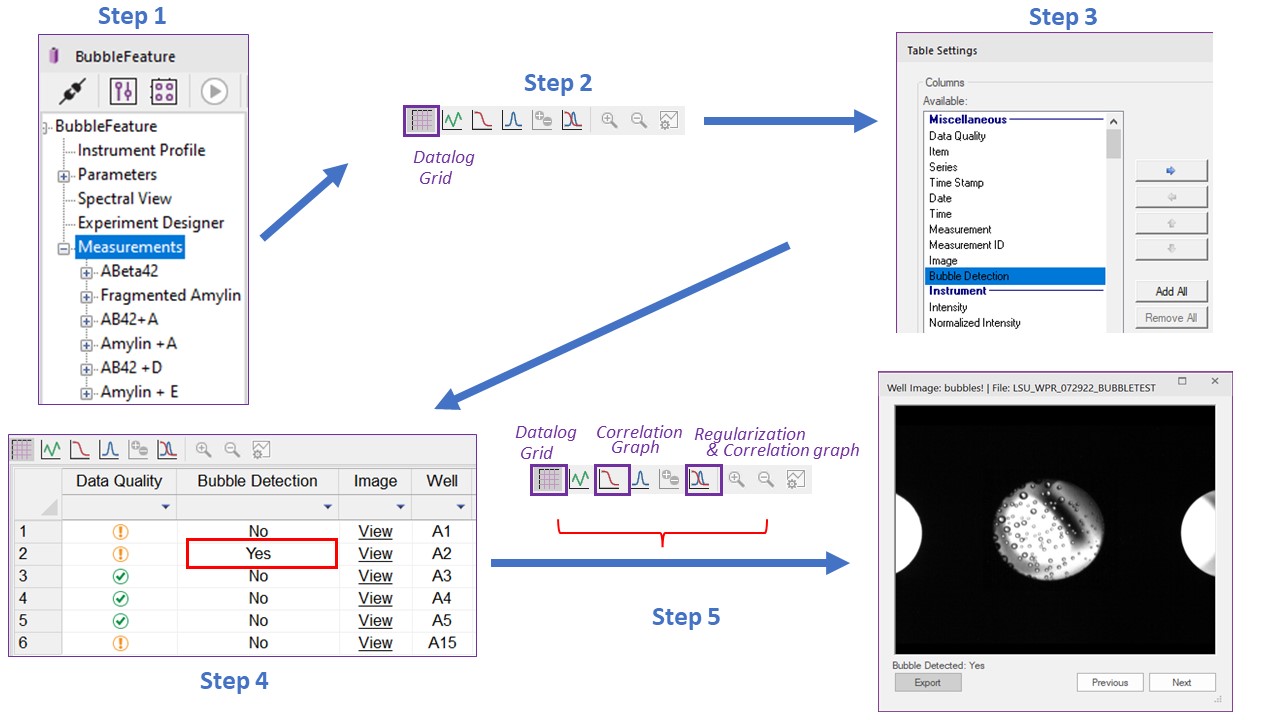
If you have enabled image acquisition with the internal camera, Bubble Detection results will be generated automatically. These results are available in the Measurements node of the Experiment tree in DYNAMICS. To view Bubble Detection status in the Datalog Grid, follow these steps:
- Go to the Measurements node in the Experiment tree.
- Click the Datalog Grid icon in the Experiment window toolbar or choose View→ Datalog Grid from the menu bar.
- Right-click on the grid, and select Table Settings; in the Available columns list that follows, select Bubble Detection from the Miscellaneous group. Click the right arrow to add it to the included list. Click OK.
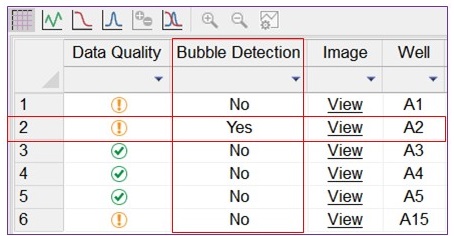
- The Bubble Detection column now appears in the grid. This column shows Yes if DYNAMICS detects a bubble in the well image and if one or more of the following is true:
- (i) The autocorrelation function baseline is high, (ii) the autocorrelation function amplitude is greater than 1, (iii) the scattering intensity is out of range, or (iv) no scattering was detected.
- In addition to viewing Well Images and Bubble Detection within the Datalog Grid, you can also access these results within the experimental window toolbar by clicking on the Correlation Graph as well as the Regularization and Correlation graph.
If Bubble Detection is not available (for example, a plate type other than 384 wells was used or no well images were taken), then the value is set to “—”. Please note that the camera automatically turns off at 50 °C, so the bubble detection feature will not work at or above this temperature. While collecting images for your measurements provide valuable information, in some instances, it may also produce a very large data file. Thus, we recommend ensuring you have sufficient storage space when recording images for large experiments!
Identify causes for poor data quality with the Bubble Detection feature
Your Plate Reader’s Bubble Detection feature can be a powerful diagnostic tool for elucidating factors that can lead to poor data quality, which can stem from a variety of reasons.
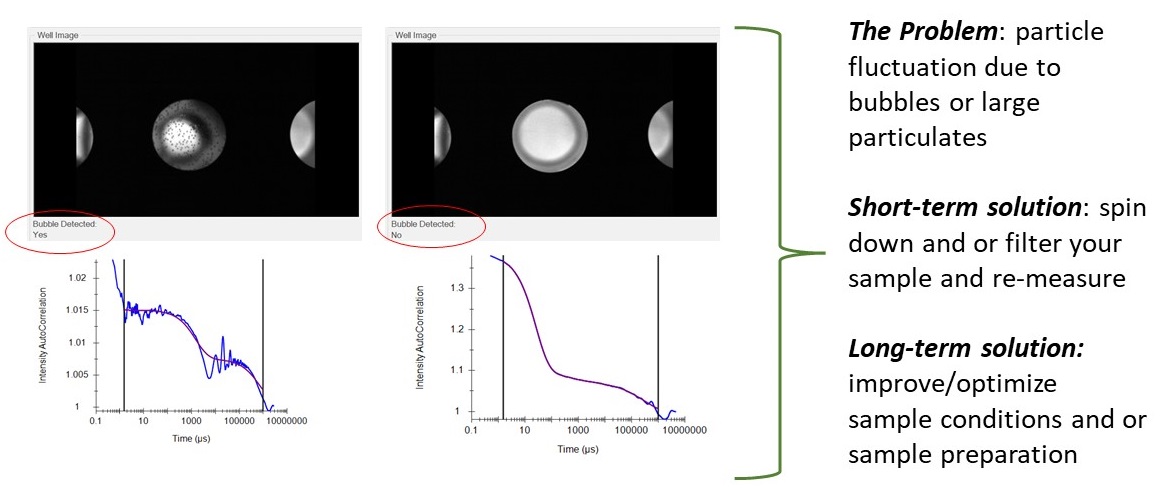
Scenario 1: Shown on the right are several undesirable autocorrelation functions (ACFs), each of which contain a “foot” and/or rapidly fluctuating intensity without well-defined baselines. These signature profiles are commonly caused by bubbles or large particulates. A quick look at the well image and the Bubble Detection feature can help determine which of these factors is responsible. Improving the data quality may require centrifugation (i.e., to eliminate bubbles or large particulates) or filtering your sample (i.e., to eliminate large particulates). Please see the last section below for general recommendations related to these protocols.
Identify poor pipetting practices
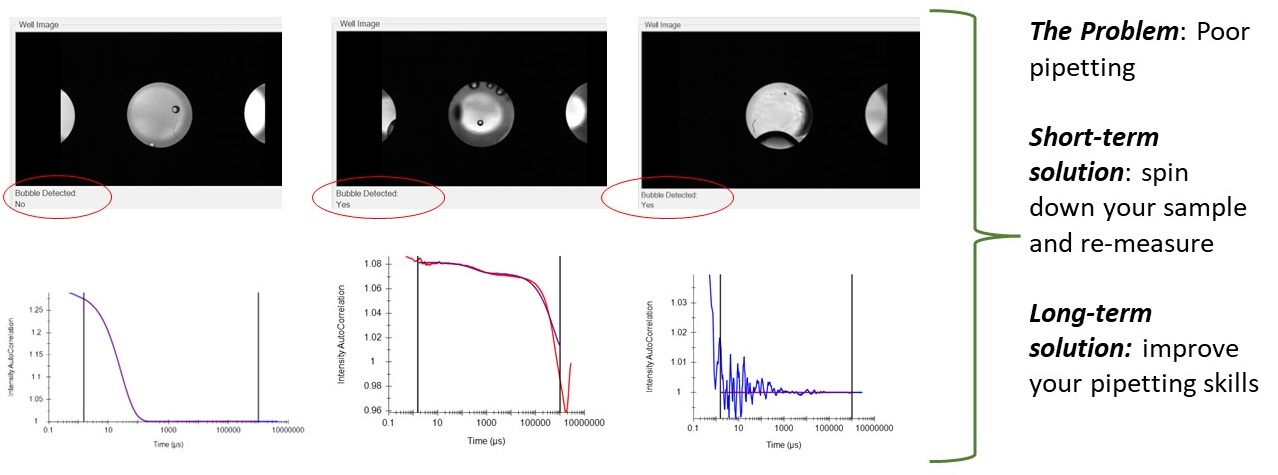
Scenario 2: The Bubble Detection and camera feature can also highlight poor pipetting practices, which result in bubbles and/or incorrect sample volumes. Both outcomes can lead to poor or inconsistent data quality. Depicted on the right are three representative samples from an experiment, which are shown alongside their well images and corresponding ACFs. Here, poor data quality is only a problem when bubbles are within the scattering volume of the sample (i.e., the presence of bubbles in a well image may not affect sample quality if the bubble(s) do not enter the optical illumination/detection volume).
Combining the well image with Bubble Detection can help determine which situation applies, highlighting underlying issues like poor pipetting practices. For example, when there is a bubble within the scattering volume of the sample, the bubble detection feature will indicate “Bubble Detected: Yes.” This occurs for the middle and far-right sample images, which are associated with poor ACFs. In contrast, if there is a bubble present in the well image, but it does not enter the scattering volume, the bubble detection feature will indicate “Bubble Detected: No.” This is true for the image on the far left, which maintains a high quality ACF even when there is a bubble in the well image. Regardless of whether bubbles contributed to poor data quality for a specific sample, their presence within the data set does, in general, reflect poor pipetting skills.
In conclusion, the Bubble Detection feature can provide clarification for root causes related to poor data quality by denoting the presence of bubbles or other particulates that entered the scattering volume of the sample. It can also be used to diagnose systematic sample preparation issues, like poor pipetting.
Using the Bubble Detection Feature to Improve Data Quality Issues
Whether due to random chance or something more systemic, like poor pipetting, once bubbles are identified as contributing to poor data quality, it’s time to remove them!
First, try to gently centrifuge to remove them. If you have access to a well plate centrifuge, start with a short (1-5 min) spin at low rpm - around 2000. Repeat if you still have bubbles. If you don't have access to a well plate centrifuge, try centrifuging the solution before dispensing.
If the Bubble Detection feature (and well image) has confirmed the absence of bubbles but you suspect particle fluctuations may be occurring —which can be due to the presence of small concentrations of large particulates—it may be necessary to filter your sample. In this case, choose a filter size that will not remove the sample of interest, while eliminating the suspected larger particles.
Please see www.store.wyatt.com to find a filter that is right for your sample.
Conclusion
Bubble Detection is available in DYNAMICS 8.2 and higher, and may be used with DynaPro Plate Reader II or III instruments when measuring 384-well plates. This feature determines if there are air bubbles in the well, facilitating robust data analysis as well as helping you to improve plate loading and sample preparation procedures. With bubbles and/or larger particulates removed, we can collect higher quality data and determine particle sizes more accurately.
Do you have a question? Contact our experts here in Customer Support. We’re happy to help! Call +1 (805) 681-9009 option 4 or email support@wyatt.com.