How do I analyze spectral data with the 3D Viewer in VISION?

Introduction
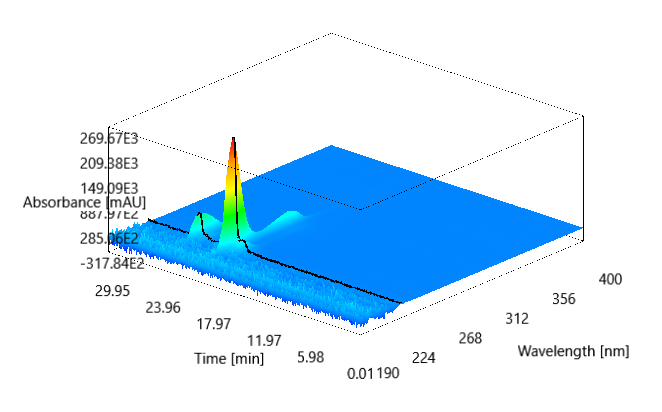
The release of VISION™ 2.0.1.2 adds a 3D viewer for spectral data (Figure 1). This allows for data across multiple wavelengths to be viewed simultaneously when performing experiments with a UV-visible photodiode-array detector (DAD or PDA), variable-wavelength detector (VWD), and/or fluorescence detector (FLD). Combined with Wyatt’s Eclipse FFF systems, the VISION software hub provides both convenience and an array of functionality, including VISION DESIGN (or SCOUT™ for legacy software) for FFF method development and analysis as well as VISION RUN (or VOYAGER™ for legacy software) for instrument control of Agilent or Shimadzu HPLC hardware.
Data Integration
DADs and PDAs allow for continuous acquisition of different UV wavelengths at the same time. On the other hand, VWDs and FLDs can scan a wavelength range in order to acquire spectral data. VISION can digitally read data from both collection strategies to generate 3D plots. This allows for a quick inspection of several data streams and the ability to gauge the appropriate UV or FLD wavelengths for analysis.
To collect data, the detector method in VOYAGER should include the appropriate configuration. Please see Figure 2 below for Agilent method settings.
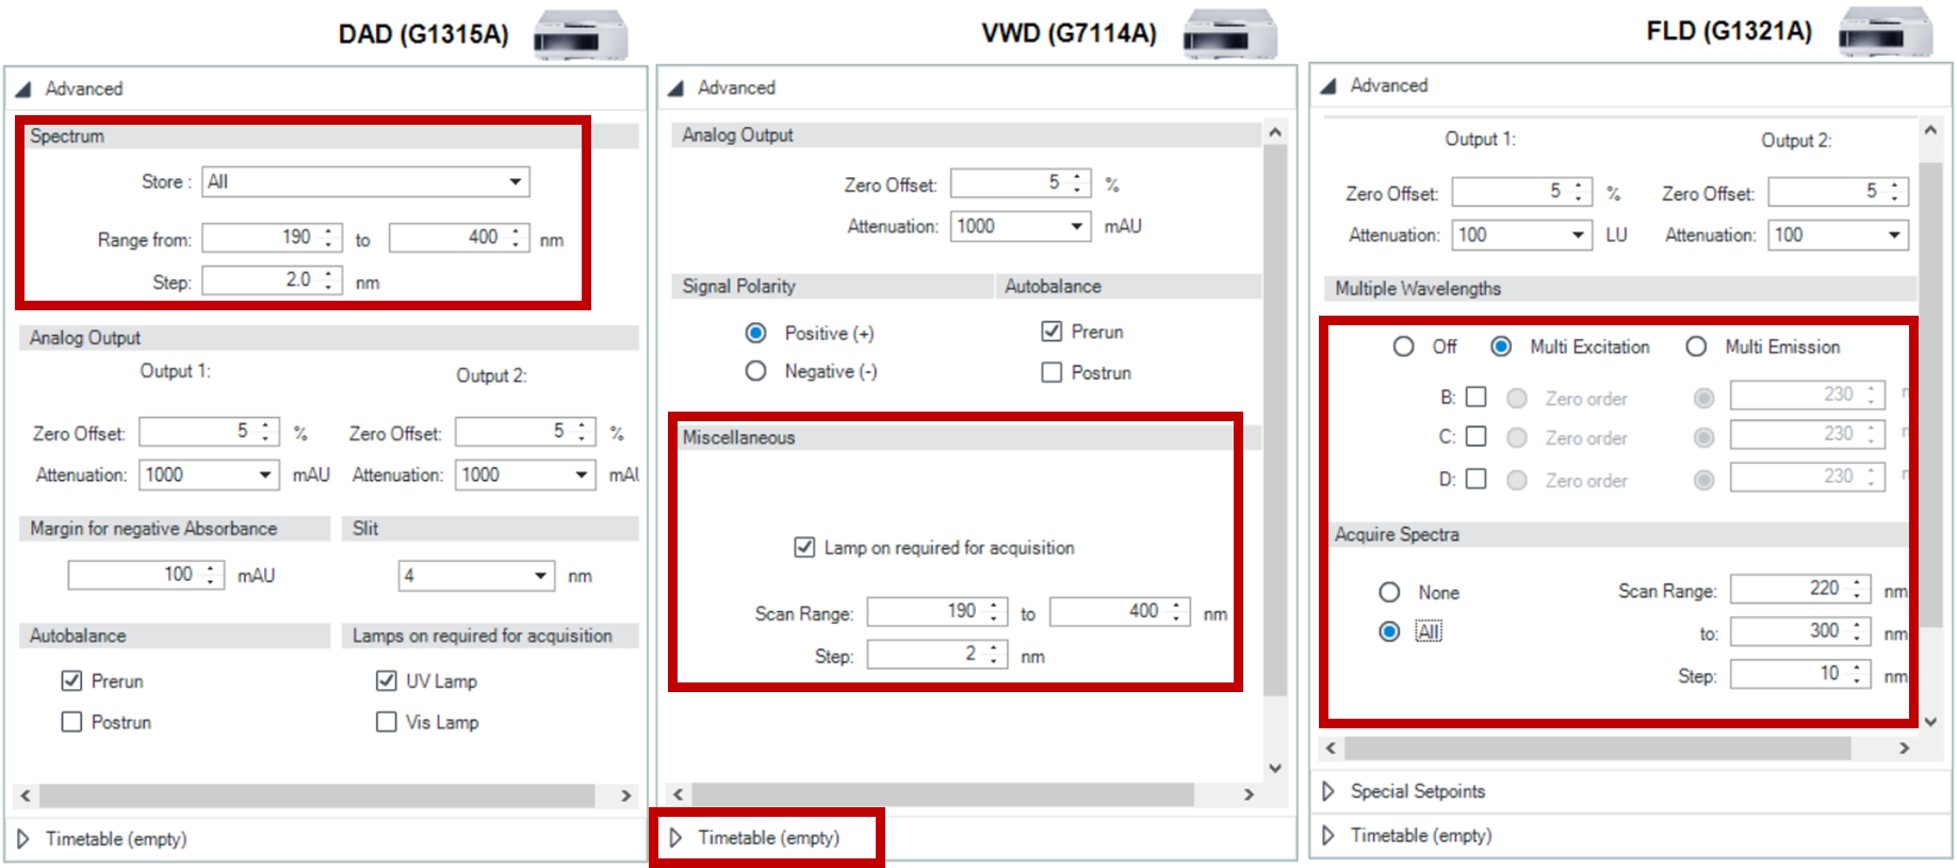
Figure 2. The appropriate method editor settings under the ‘Advanced’ tab in VOYAGER for collecting spectral data for a DAD (left), VWD (middle), or FLD (right) with Agilent detectors. Under the ‘Advanced’ tab in the Method Editor, DAD settings should have “Store: All” enabled and the desired scan range and step selected; VWD settings should select the scan range and step as well but additionally add ‘Take Scan’ to the timetable option as a line in the method; FLD settings should toggle on either ‘Multi Excitation’ or ‘Multi Emission’ and then enable ‘Acquire Spectra: All’ and select the scan range and step.
Shimadzu PDAs
For Shimadzu PDAs, collection options including scan range and steps can be configured under ‘3D data acquisition settings’ shown in Figure 3.
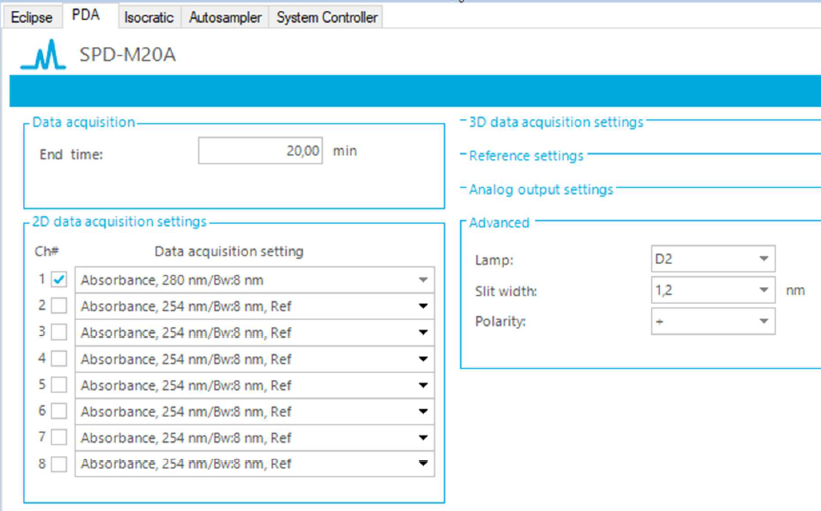
Figure 3. Configuration of Shimadzu PDA settings for 3D data acquisition.
Viewing Spectral Data
VOYAGER will then generate a corresponding SCOUT data file with each experiment run, that will include a Spectrum View node for those data. The spectral data for a collection can be found under the experiment header, as shown in Figure 4.
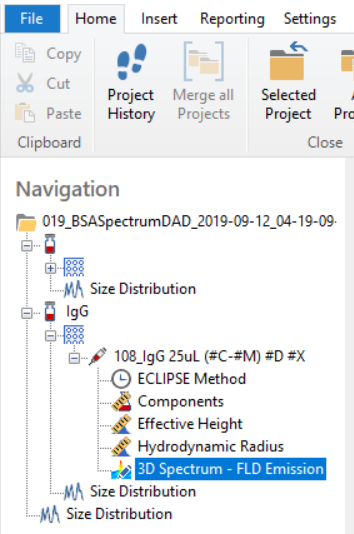
Figure 4. Location of the 3D Spectrum view in SCOUT under the experiment node.
3D Spectral View
Once selected, the 3D Spectral View will be provided in the right-side window and the 2D graph showing the detector signal versus time will be displayed on the left. This layout is shown in Figure 5.
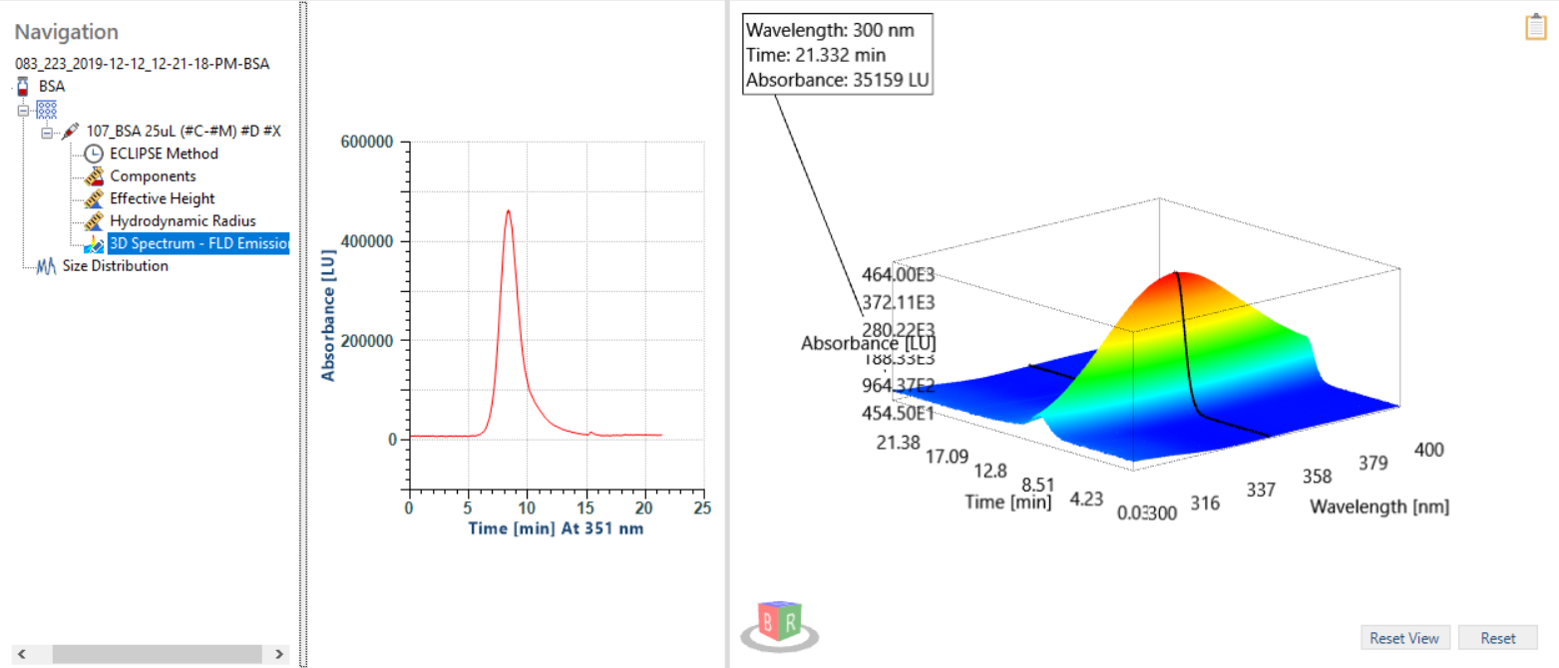
Figure 5. SCOUT interface for controlling and viewing the 3D spectral view, including the cube view, the reset buttons, and the clipboard options icons. This example data file is from an FLD emission spectrum of an FFF separation of BSA.
Spectral Data
To control and change the view of your spectral data:
- Right-click and drag to rotate the spectral view (alternatively, the arrow keys can be used).
- Middle-click and hold to pan (alternatively, the Shift + arrow keys can be used).
- Click on the box in the lower left of the spectral view to adjust the view to a particular direction. (For example, the ‘U’ face of the cube will show the 3D graph from directly above.)
- Left-click on the graph itself and drag to highlight and select an area of interest and focus on only that section. Clicking ‘Reset’ in the lower right of the view will undo this.
- Select ‘Reset View’ in the lower right to reset the camera angle and zoom.
If you would like to use the spectral data in a report, the clipboard icon at the upper right can be left- or right-clicked to copy the image of the current graph showing absorbance versus wavelength and time. Pressing CTRL + C will copy both the graph and the callout. The table data can also be copied, and saved as a .csv file.
Conclusion
Do you have a question? Contact our experts here in Customer Support. We’re happy to help! Call +1 (805) 681-9009 option 4 or email support@wyatt.com.