How do I determine particle concentrations for multimodal samples in DYNAMICS?

Introduction
With the release of the DYNAMICS™ software version 7.10, multimodal samples measured with a DynaPro™ ZetaStar, NanoStar™ or Plate Reader III can be analyzed to quantify particle concentration. This adds an important tool for high-throughput screening of complex samples where different sized populations are present. For example, monomeric capsid concentration can be determined while simultaneously screening Adeno-associated virus (AAV) samples for aggregation during formulation and process development.
Figure 1 shows an example of the regularization graph in DYNAMICS, highlighting the particle concentration of each component in a mixture of two polystyrene latex beads with nominal radii of 10 and 50 nm.
Monomodal vs. Multimodal Sample Analysis
To enable particle concentration in the DYNAMICS software, under the Parameters/Sample, set Particle Concentration Calculation to Yes and select the Particle Material from the list of options. The particle concentration of each peak is calculated according to the procedure detailed in a previous Ask an Expert article, How do I use the new particle concentration feature in DYNAMICS? The calculation uses the hydrodynamic radius measured by dynamics light scattering (DLS), total static light scattering (SLS) intensity at the instrument’s scattering angle, and the Lorenz-Mie shape model for a solid sphere.
For monomodal samples it is assumed that all the particles in the scattering volume are the same size and shape in the particle concentration analysis, so the hydrodynamic radius Rh obtained by the cumulants fit is used. For multimodal samples, regularization analysis results are used and each peak is considered to be monodisperse, while the peak width indicates the uncertainty.
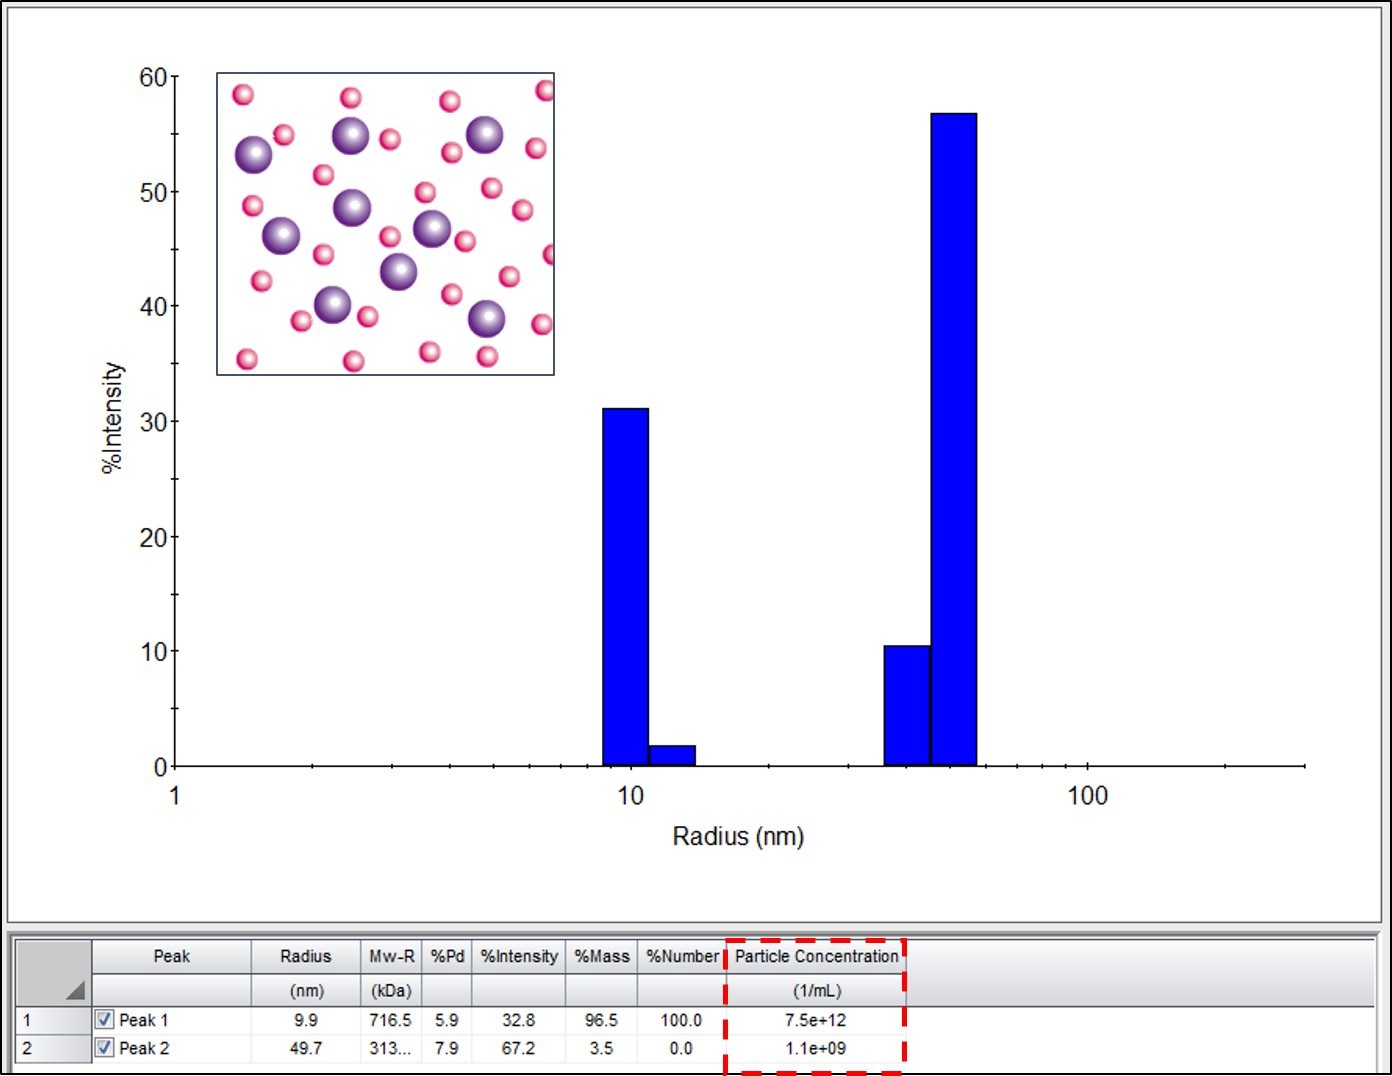
Figure 1. The regularization graph in the DYNAMICS software with particle concentration analysis for the mixture of two polystyrene latex beads (represented by the inset, not in scale) with a nominal radius of 10 nm and 50 nm. Particle concentration for each peak is shown in the table below. To add columns such as particle concentration to a regularization table, right-click on an empty space in the column heading, select Table Settings, and choose the columns to add.
Viewing Results for
Multimodal Samples
After running your samples, the particle concentration analysis can be seen for each peak range under the regularization graph as shown above in Figure 1. You can also setup the datalog grid to show particle concentrations for each peak range as shown in figure 2.
The peak ranges DYNAMICS uses for the regularization analysis can be customized for multimodal samples with different size ranges as shown in the figure 3.
When performing particle concentration measurements, it is important to consider the following:
- Particle concentration calculations use SLS measurements, which requires an SLS calibration. For the ZetaStar and NanoStar, calibration is performed with toluene in the quartz cuvette. When using a DynaPro Plate Reader III, the well plate must be calibrated with a concentration series of dextran.
- The maximum allowable Rh for particle concentration analysis is 225 nm in a ZetaStar, 175 nm in a NanoStar, and 160 nm in a DynaPro Plate Reader III. If the measured Rh is greater than this limit, DYNAMICS will not report the particle concentration.
- Multi-modal particle concentration analysis requires well-resolved regularization peaks. A size difference of at least 3-5x between the two modes is required to resolve them.

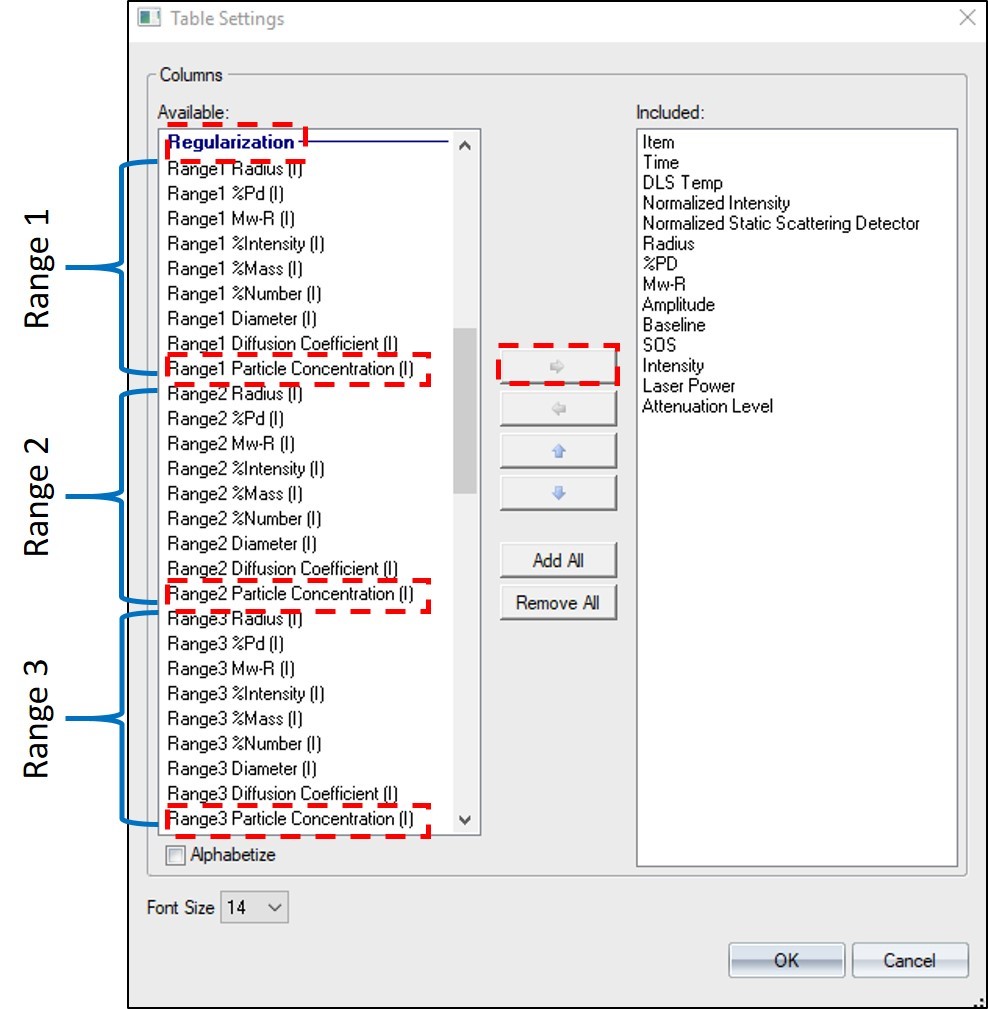
Figure 2. To display particle concentration in the Datalog Grid, right-click on the grid and select Table Settings. In the Table Settings menu (bottom), scroll down to Regularization and add as many ranges as there are peaks present (Range 3 is shown but not selected in this specific case).
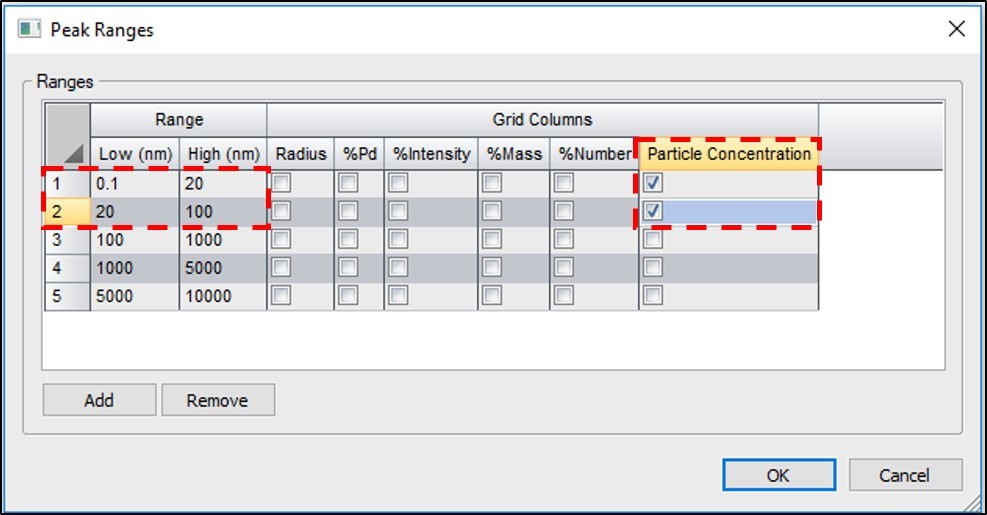
Figure 3. To set the peak ranges for your sample, right-click on the Datalog Grid and enter the low and high range for the radius. You can also check the box for a grid column in this menu to have it added to the datalog grid columns.
Additional Notes
Multimodal analysis of particle Concentration measurements is only available in DYNAMICS 7.10 and higher for the DynaPro ZetaStar, NanoStar, and Plate Reader III. For more details see the DYNAMICS 8 User’s Guide or check out TN2011: Performing Particle Concentration Measurements in DYNAMICS.
Do you have a question? Contact our experts here in Customer Support. We’re happy to help! Call +1 (805) 681-9009 option 4 or email support@wyatt.com.