How quickly can a shift in molar mass be detected with RT-MALS?

Introduction
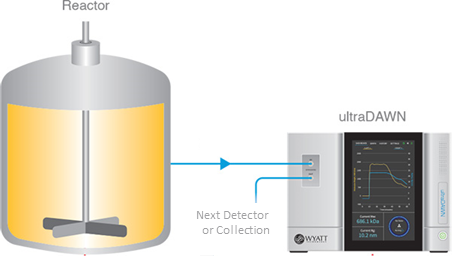
Molar mass and size is measured in real-time in ultraDAWN. However, there is a lag time for when a change in molar mass will be seen in ultraDAWN relative to when it actually occurs in the reactor or sample chamber. The lag time depends on the specific configuration. The figure below shows the configuration for in-line RT-MALS.
The in-line RT-MALS configuration is ideal for continuous processes that take place at flows of 5 mL/min or lower, such as microfluidic drug encapsulation or chromatographic purification steps. In-line RT-MALS provides the shortest feedback loop while the ultraDAWN samples the entire process stream. In this configuration the lag time can be as low as 2-3 seconds.
On-line RT-MALS
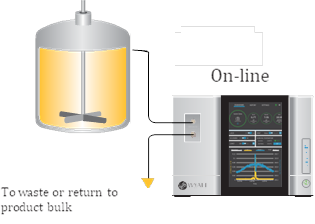
This figure shows the configuration for on-line RT-MALS.
The on-line RT-MALS configuration can be used when the process flow is greater than 5 mL/min, or when the process takes place entirely within a vessel such as a reactor. In this configuration, a bypass stream is diverted from the manufacturing process and a quaternary pump is used to deliver the sample into ultraDAWN. In this configuration, the lag time can be as low as 15-20 seconds.
Utilizing a quaternary pump is essential when the sample is highly viscous (>15 cP) or when the sample exhibits high self-interactions. In these cases, the quaternary pump can reduce the viscosity and self-interactions by mixing the bypass stream with the sample formulation. An important consequence of this mixing is an increase in the lag time which is directly proportional to the dilution factor. Thus, a tenfold dilution will result in a tenfold increase in lag time.
Residence Time Delay (RTD)
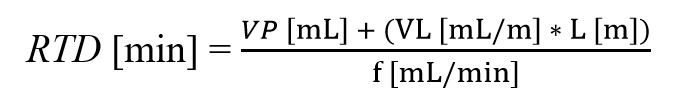
The technical term for lag time is referred to as the Residence Time Delay (RTD) which depends on the flow rate, tubing inner diameter, tubing length, presence/absence of pump, and sample dilution factor. Highly viscous samples (>15 cP) require a larger inner diameter tubing to reduce backpressure. Utilizing a larger inner diameter increases the RTD since the sample must pass thru a larger volume to arrive at ultraDAWN. The Residence Time Delay (RTD) equation is shown.
VP = Delay volume in the pump. Typically 1 mL.
VL = Volume per meter of sample tubing.
L = Length of the sample tubing in meters. Typically 1 m.
f = Flow rate in mL/min. Typically 1-5 mL/min.
The Volume per meter of sample tubing equation(VL) is also shown.
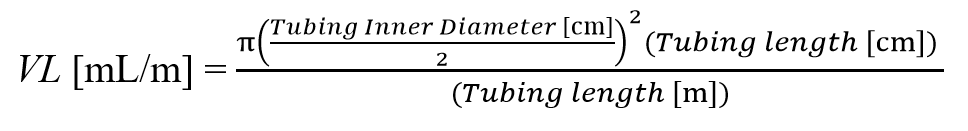
Tubing Inner Diameter
The Tubing Inner Diameter can be set to 0.030 or 0.0625 inches.
The table shows the RTD for 0.030 or 0.0625 inch Tubing Inner Diameter and for different sample dilutions.
Relative Time Delay Table
| Tubing Inner Diameter (inch) | Flow rate (mL/min) | No Sample Dilution (sec) | Five Fold Sample Dilution (sec) |
| 0.03 | 5 | 17 | 87 |
| 0.0625 | 5 | 36 | 180 |
| 0.03 | 1 | 87 | |
| 0.0625 | 1 | 180 |
Example:
Calculate the RTD with the following assumptions:
- L = Length of the sample tubing in meters = 1 meter
- f = Flow rate in mL/min = 1 mL/min
- VP = Delay volume in the pump = 1 mL
- Tubing Inner Diameter = 0.0625 inches (0.15875 cm)
- No sample dilution
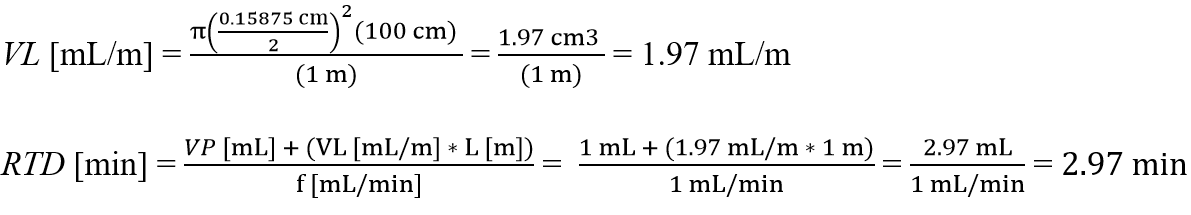
Conclusion
A change in molar mass in the reactor will be seen approximately three minutes later in ultraDAWN for this configuration.
Do you have a question? Contact our experts here in Customer Support. We’re happy to help! Call +1 (805) 681-9009 option 4 or email support@wyatt.com.