Measuring turbidity/opalescence
During formulation and other product development stages, biopharmaceuticals are subjected to various excipients as well as temperature, pH and concentration conditions. Some combinations of these may cause abrupt changes in solution behavior, such as liquid-liquid phase separation, precipitation or aggregation, leading to opalescence.
Opalescence is generally undesirable due to the poor aesthetic appeal of the drug product. However, it may also indicate problems in the drug's manufacturability, stability and deliverability. Therefore, quantifying opalescence or turbidity is beneficial to selecting appropriate formulations and is more desirable if it is done simultaneously with other key measurements.
Who measures turbidity?
- Protein characterization scientists studying the behavior of proteins under stressed and long-term storage conditions
- Formulation researchers working with high-concentration solutions
- Small-molecule drug manufacturing industries determining drug solubility
- Release labs evaluating the aesthetic appeal of the final product


Visual evaluation is the standard method of monitoring opalescence. However, the visual acuity of one analyst compared to another is inherently variable and lacks impartial reproducibility.
Instruments that measure turbidity provide robust, reproducible measurements and are preferred over visual analysis. Although these instruments deliver turbidity information, they require milliliter quantities of solution and are limited in determining other, valuable product attributes.
Evaluating opalescence or turbidity of formulations is crucial both in early development, where the materials are limited by quantity, and in later stages where the formulations are at high concentrations.
A single instrument, capable of quantifying turbidity along with multiple other attributes of the formulation with reduced sample consumption, measurement time and effort, is ideal.
Quantifying turbidity: Overcoming limitations
Single measurement – microliter volumes – multiple product attributes
The DynaPro® NanoStar® and the DYNAMICS® Touch™ software, its onboard app for walk-up operation, provide important analyses on as little as 2 µL of sample. The NanoStar is the only cuvette-based dynamic light scattering (DLS)/static light scattering (SLS) instrument that provides accurate temperature-controlled nephelometric measurements of opalescence/turbidity while simultaneously determining hydrodynamic size (Rh) and molecular weight (Mw), aggregation and stability indicators (Tonset, Tm, Tagg, kD, A2).
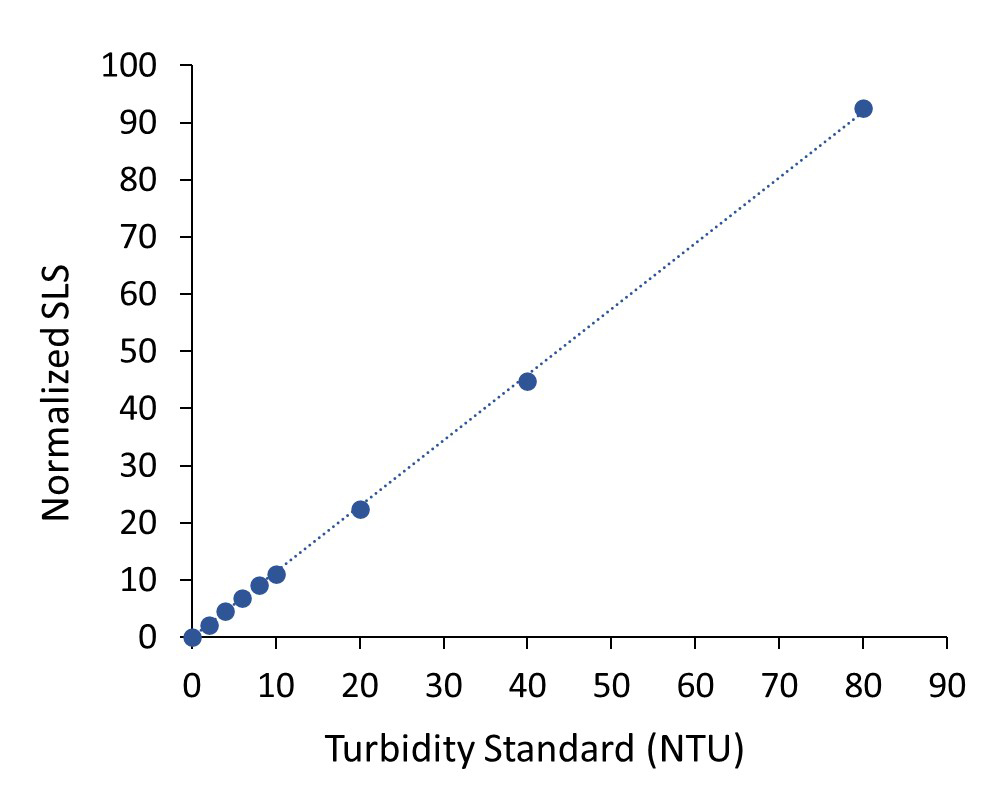
The DynaPro NanoStar provides remarkable linearity of SLS detector response with turbidity standards within an NTU range relevant to most protein formulations.
Key features:
- Microliter sample volume
- Opalescence from 1 to 80 NTU
- Rh from 0.2 to 1000 nm
- Temperature control from -10 °C to +120 °C
- DYNAMICS Touch onboard app for walk-up operation
DynaPro NanoStar conforms to US & European Pharmacopoeia standards
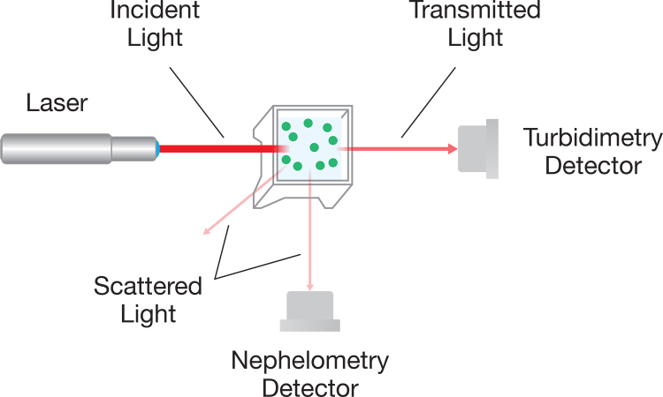
Turbidimetry and nephelometry are the two instrumental modes of measuring opalescence or turbidity according to USP <855> and Ph. Eur. 2.2.19. The turbidimetric method measures the difference in intensity between the transmitted beam and the incident beam. However, it is limited in sensitivity at low turbidity levels due to the relatively small changes in the intensity of the transmitted beam relative to the baseline level.
The DynaPro NanoStar can be used in a nephelometric mode wherein it measures the intensity of the scattered light at a 90° angle from the incident beam. This configuration has little to no intrinsic background and is highly sensitive to the low turbidity levels typically found in therapeutic proteins or peptide solutions.
Case studies
Opalescence at high protein concentration
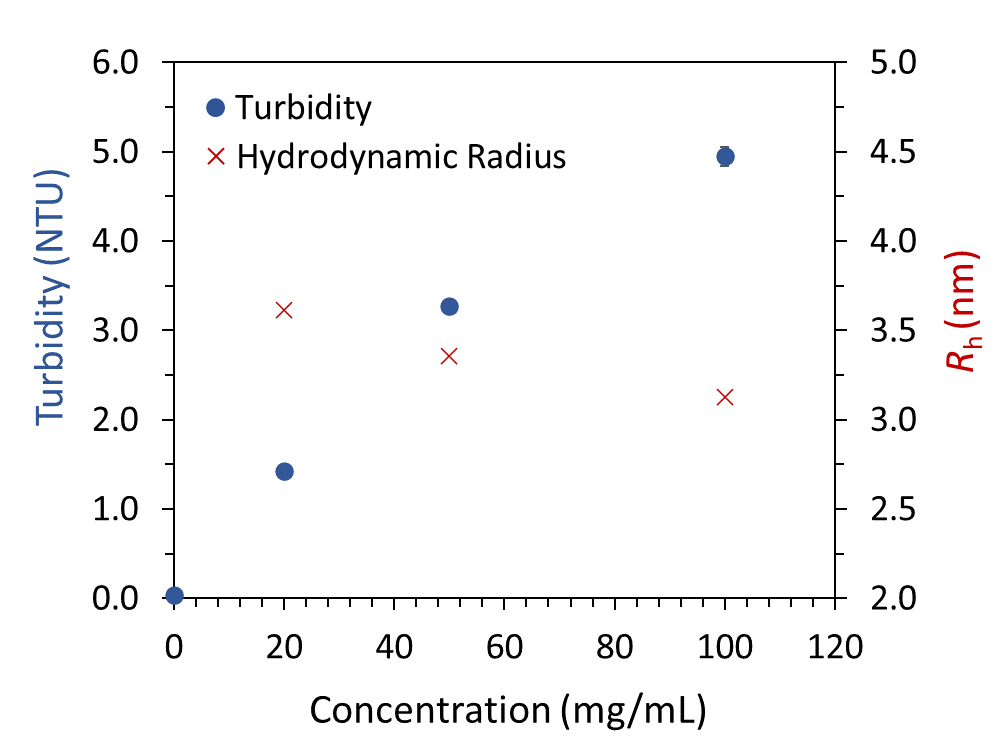
Simultaneous DLS and SLS analyses reveal changes in turbidity and apparent Rh of a protein solution with increasing concentration.
Thermal stability of proteins via turbidity
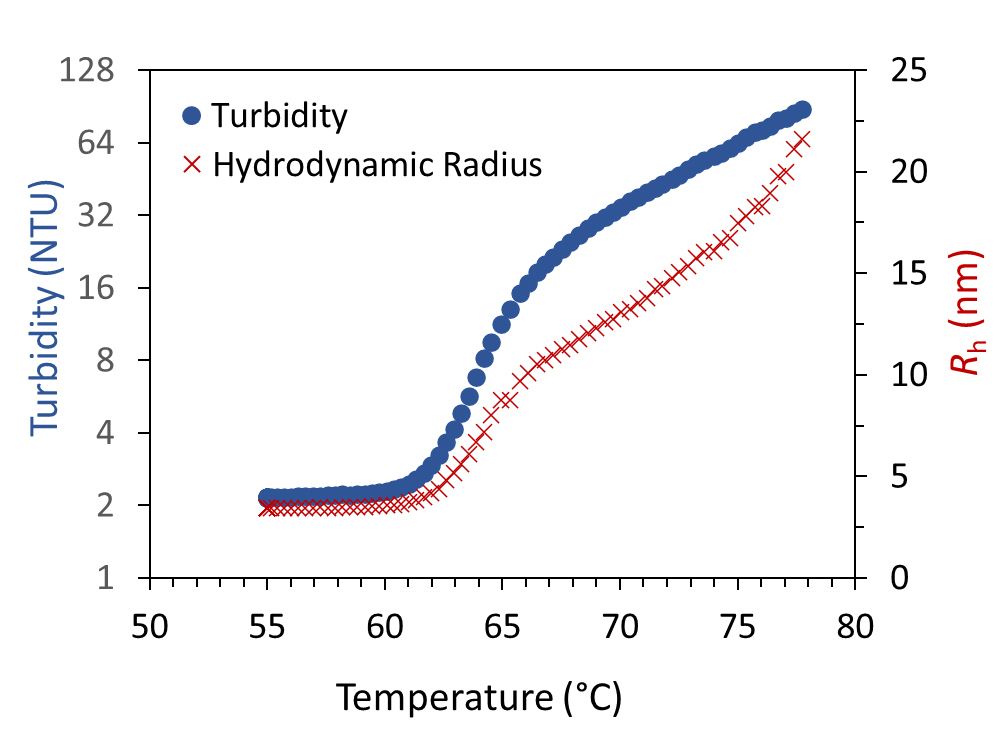
Exposing 20 mg/mL BSA to a continuous temperature ramp results in two thermal transitions and an increase in turbidity and Rh due to aggregation.
Workflow
There are two user interfaces for acquiring turbidity analyses with the DynaPro NanoStar II or ZetaStar™.
- DYNAMICS Touch is an on-board application offering quick and easy walk-up measurements
- DYNAMICS® is a PC-based interface to collect more comprehensive information on multiple samples
The video on the right demonstrates a sample collection sequence in DYNAMICS Touch.
Publications
- Barros. M., Zhang. X., Kenrick. S., Joseph. J.V. Opalescence Measurements: Improvements in Fundamental Knowledge, Identifying Sources of Analytical Biases, and Advanced Applications for the Development of Therapeutic Proteins. Journal of Pharmaceutical Sciences. 110, 3550-3557 (2021). https://doi.org/10.1016/j.xphs.2021.06.013
- Kingsbury. S. J. et al. Characterization of Opalescence in low Volume Monoclonal Antibody Solutions Enabled by Microscale Nephelometry. Journal of Pharmaceutical Sciences. 110, 3176-3182 (2021). https://doi.org/10.1016/j.xphs.2021.05.005
- Kingsbury. S. J. et al. A single molecular descriptor to predict solution behavior of therapeutic antibodies. Science Advances. 6, eabb0372 (2020). https://doi.org/10.1126/sciadv.abb0372