ASTRA
Turn your data into results with the ultimate in light scattering software—ASTRA.
The most powerful and versatile software available for the characterization of macromolecules and nanoparticles via multi-angle and dynamic light scattering.
- Maximize your productivity via ASTRA's One-Click MW™ feature, automated multi-sequence processing and HPLC integration.
Take advantage of its integrated control of Agilent systems, or its support for Waters Empower sequences.
ASTRA offers a suite of basic and advanced analyses, including customized reports and an optional 21 CFR Part 11 and EU Annex 11 compliant security and database package.
It greatly simplifies MALS and DLS analysis, so you can quickly and accurately assess molar mass, size, conformation, conjugation and other essential physical parameters.
With each analysis, ASTRA provides the quantitative experimental uncertainties that transform mere numbers—into science.
ASTRA Features and Capabilities
Browse these tabs to learn about the many capabilities and features in ASTRA which make it is the most powerful and versatile software available for the characterization of macromolecules and nanoparticles via multi-angle and dynamic light scattering.
One-Click MW™
Don't waste time - from sample to results in one click. Read more...
HPLC Control
ASTRA's integrated HPLC Control delivers a one-stop solution for SEC-MALS.
Read more...
Unmatched Analysis
ASTRA offers extensive options for analyzing specific physical properties of proteins, polymers and nanoparticles.
Read more...
Versatile Reporting
Fully-customizable reports provide the results you need with your company logo.
Read more...
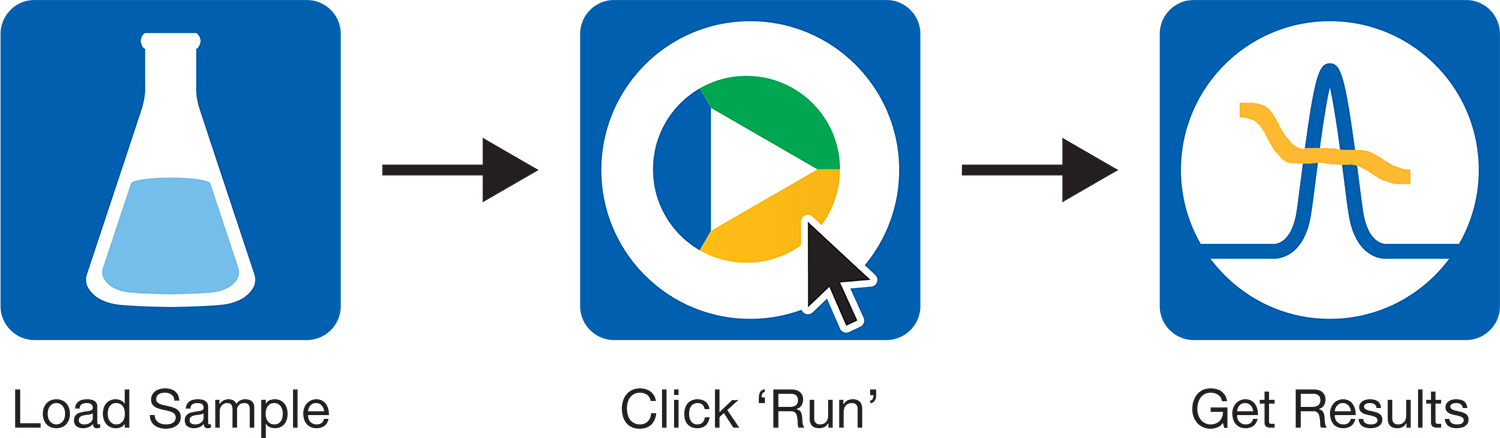
One Click: From Sample to Results
ASTRA increases productivity for routine analyses
Running a SEC-MALS analyses has never been easier. ASTRA’s One-Click MW™ feature complete an entire method at the click of a button.
Click on Run Default and ASTRA will:
- Synchronize data collection with your HPLC
- Autoprocess data to determine MW and radius
- Generate custom reports and graphs
- Prepare for the next run

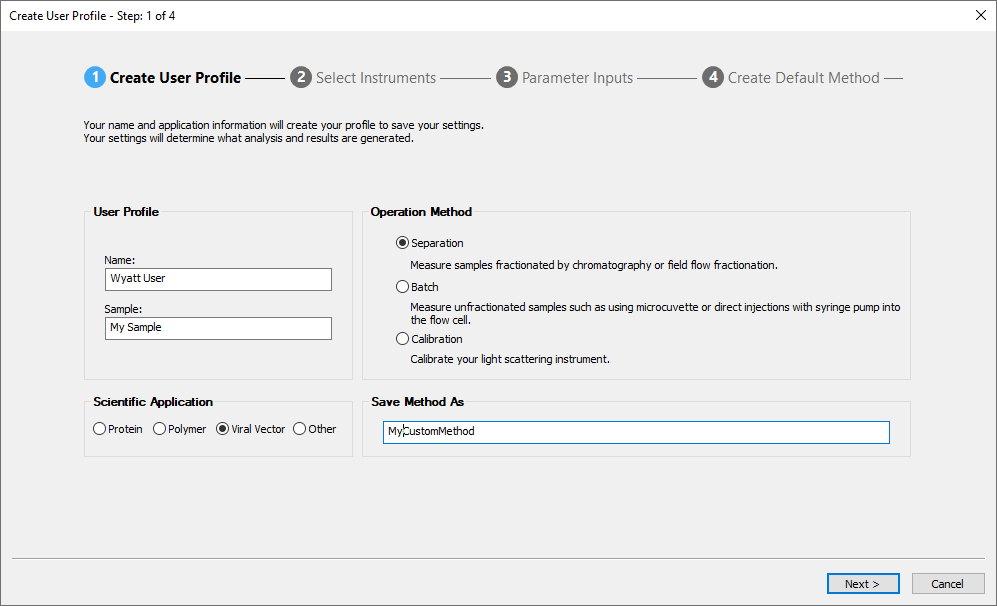
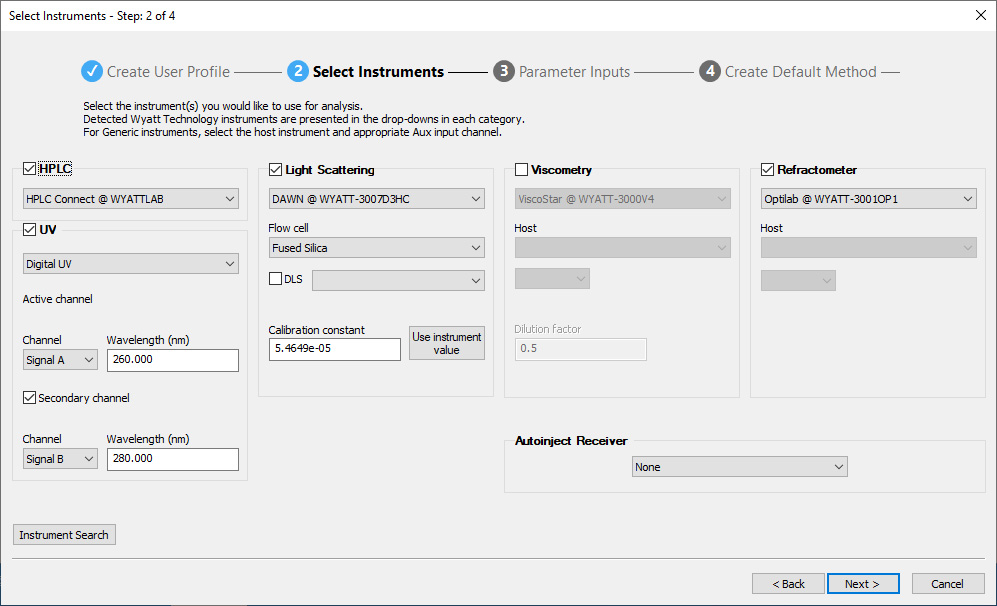
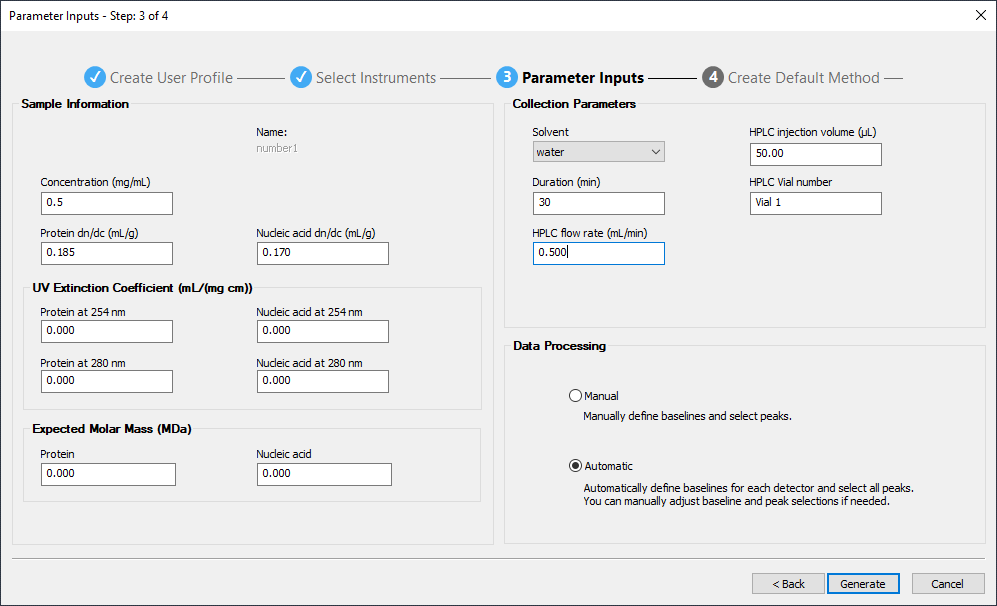
Method Builder
ASTRA's Method Builder simplifies the specification of methods for the most common protein and polymer analyses, in three intuitive steps:
- Choose your scientific application
- Specify the instruments
- Enter sample and run parameters
Then save the method, load the sample(s), click Run Default and return later to find out the MW results in the final report.
Freedom to Explore
With ASTRA, you are never locked in to default methods or standard procedures. You always* have access to each parameter and processing step to review, validate and improve.
*Except network accounts where access is limited under the 21 CFR Part 11 compliant Security Pack.
Ahead of the Curve
As you build expertise and confidence, and move on to complex analyses, ASTRA allows you to refine the results of automated processing with fine adjustments to peak selection, baseline specification, detector filtering and other settings.
A Complete SEC-MALS Solution
- Minimizes user errors
- Runs SEC-MALS from a single, familiar environment
- Saves you time and money
ASTRA's HPLC CONNECT module works with standard Agilent HPLC hardware including pumps, autosamplers, column ovens, UV/Vis detectors, and fraction collectors.
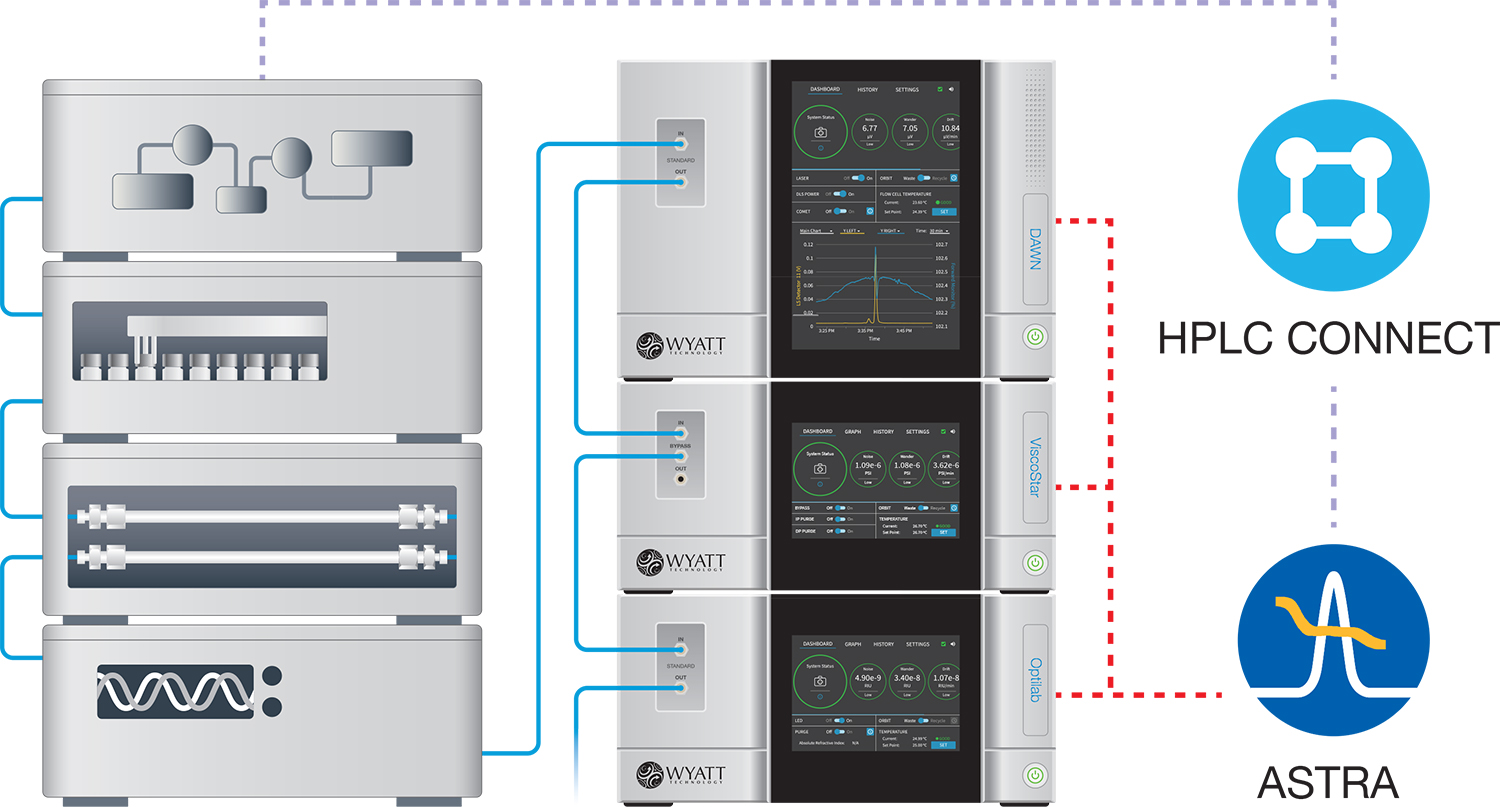
Integrated HPLC control with HPLC CONNECT
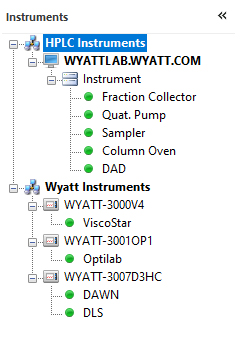
Let ASTRA take control of your HPLC stack for effortless synchronization between injections and data collection. ASTRA eliminates the need for separate HPLC and light scattering software. HPLC modules are listed together with Wyatt detectors in a common experiment configuration, and key parameters such as vial position, injection volume and flow rate are specified in ASTRA's sequences.
Digital signal acquisition
HPLC CONNECT controls UV/VIS detectors directly within ASTRA. Set UV parameters and acquire all signals digitally, without any external cabling required. Select up to two UV channels for analysis – even post-collection.
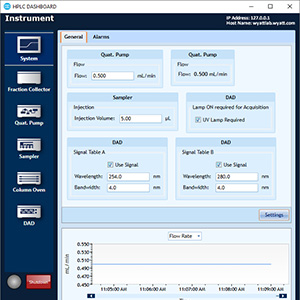
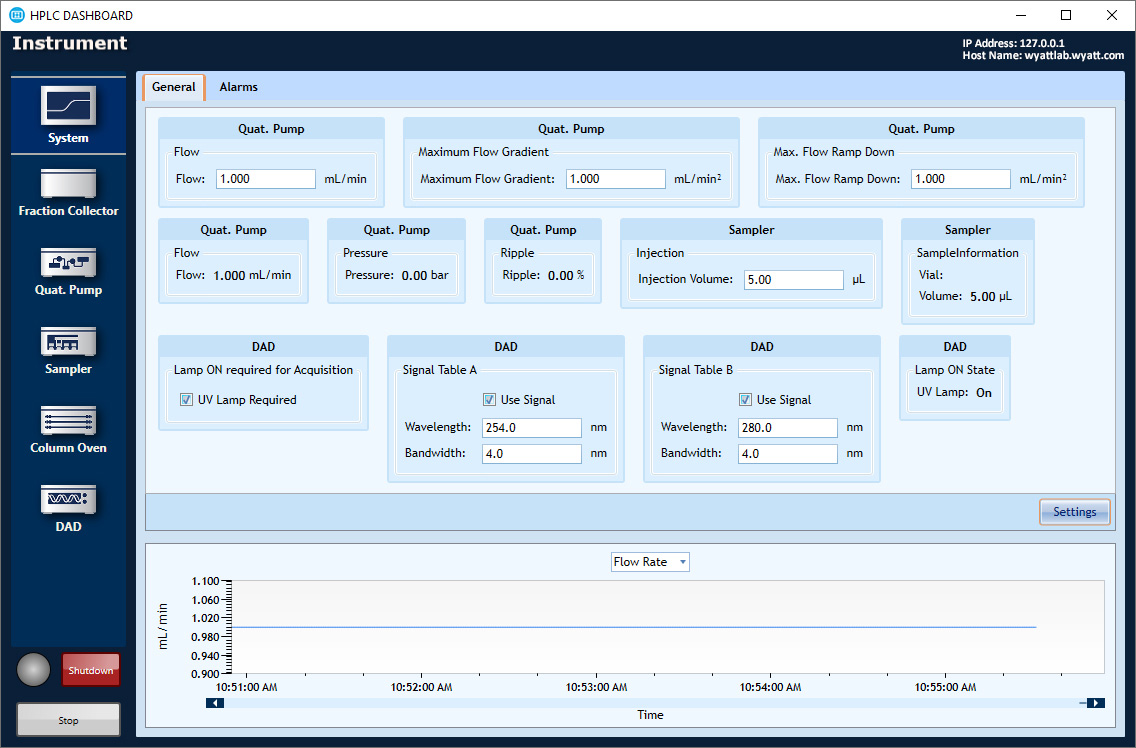
HPLC CONNECT: Your Dashboard
The HPLC DASHBOARD application controls and monitors HPLC modules including pumps, column ovens, UV detectors and autosamplers, right from the desktop. Included at no additional cost with HPLC CONNECT.
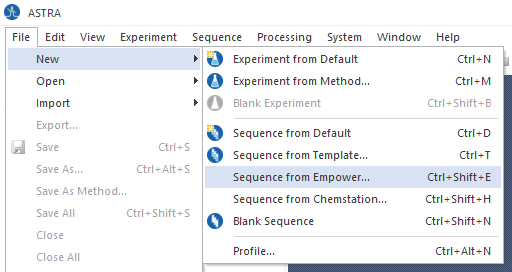
Interoperability with Waters Empower Software
ASTRA can connect directly to Waters Empower™ chromatography software to read in sample sets. Users just set up their runs in Empower, then import the method information—including sample names and identifying information—to create ASTRA sequences.
Processing with Ease
Built from the ground up to handle large sets of data with ease, ASTRA has the tools you need to process and report on sequences containing many samples, including replicates. The "One-to-Many" batch processing feature lets you focus on your goals, and leave the drudgery to the computer.
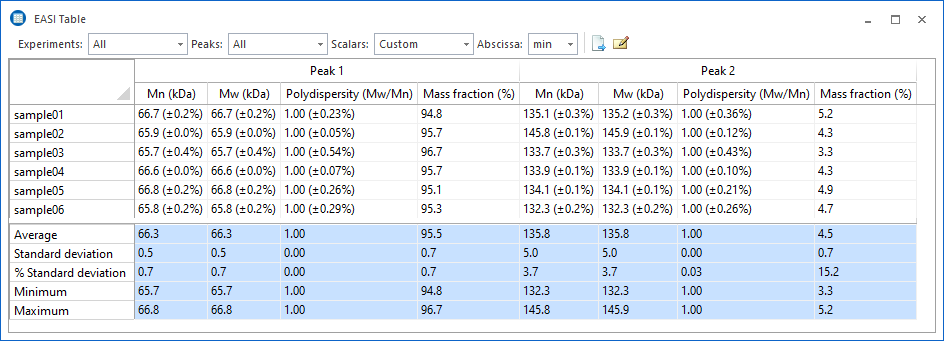
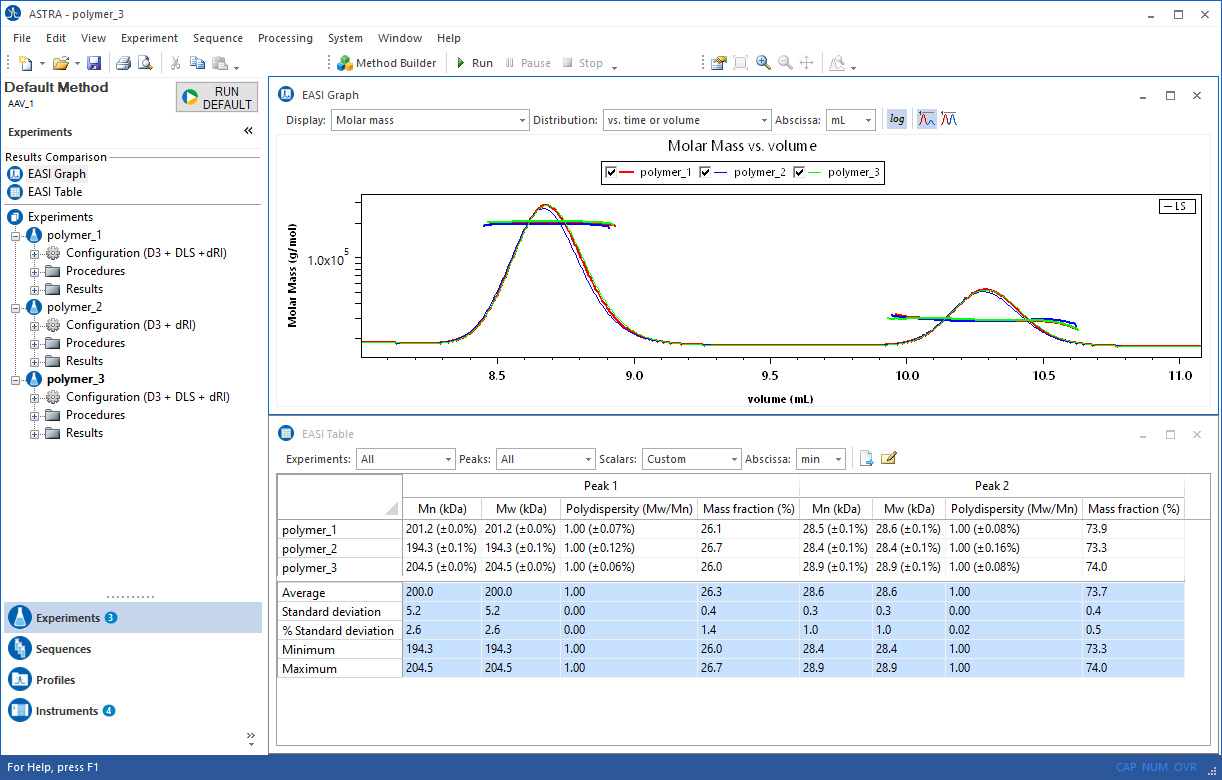
EASI Table
Everything you need at a glance.
Quickly compare multiple data runs with the EASI Table feature to assess analyte stability and consistency. The table data can be exported in a variety of formats, or copied and pasted into your favorite word processing or spreadsheet software.
Fully customizable.
Specify which data should be displayed in EASI Table, as well as the format and precision used to display the values. Choose from percent or numerical uncertainties, or omit them entirely.
Sequence Processing
Collect data while you sleep.
Sequences are used to specify and control the automated collection of data as well as system functions. A sequence can be configured with the default method or a different method can be specified for each sample. Sequences also perform post-collection maintenance, such as running the COMET™ flow cell cleaner, switching the UV lamp off or switching the Orbit™ to solvent recycle mode.
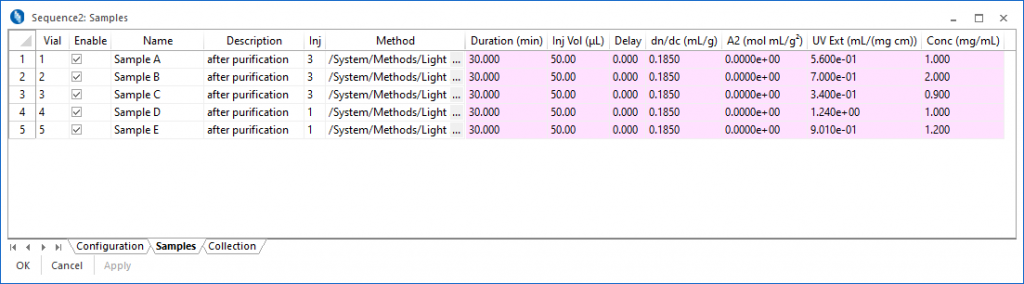
In the Samples view, it is possible to modify sample parameters on-the-fly, adding samples, changing collection times, or skipping samples.
Let your computer do the work.
ASTRA allows you to process an experiment as you wish, then instruct the computer to apply the same settings and analysis steps on any number of additional data files. You can quickly and easily specify which elements of your 'source' experiment should be incorporated in the target experiments.
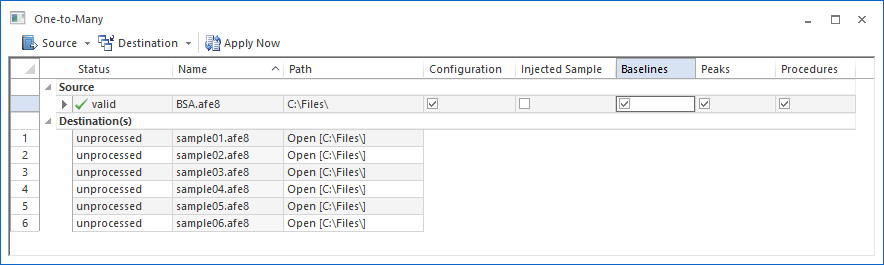
Once the processing is finished, your resulting data files are fully analyzed and ready to be reviewed.
Unmatched Analysis
Building on over 40 years of light scattering research and development, ASTRA includes an unrivaled range of analysis features. ASTRA takes full advantage of modern multicore computers, processing data at high speed and with superior accuracy. It is available in a 64-bit version.
Molar Mass Determination
Molar Mass via Light Scattering
Light scattering stands alone in its ability to measure the molar mass of macromolecules in solution both accurately and quickly.
Learn more…
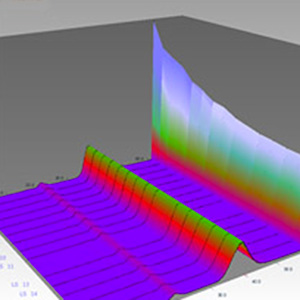
Distributions
Molar mass and size are determined across peaks in a chromatography run, and moments such as number- weight- and z-average are calculated. ASTRA also supports visualizing the distribution of these measured quantities. This is extremely powerful in assessing how much of a sample falls with a particular range of molar mass or size. Learn more…
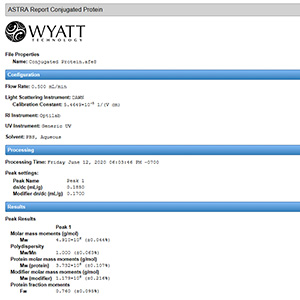
Protein Conjugate and Copolymer Analysis
If you have an RI detector, a UV detector, and a light scattering instrument, you can directly measure the molar mass, size, and relative fractions of copolymers and protein conjugates. Learn more…
Viral Vector Analysis
The powerful combination of SEC-MALS-UV-RI with ASTRA enables the determination of three critical quality attributes in a single assay: particle concentration, capsid content and aggregation.
Learn more…
Nanoconjugate Analysis
The Nanoconjugate Analysis applies a proprietary algorithm to quantify the nucleic acid or drug payload in analytes that are too large for standard conjugate analysis (they scatter UV light). Since the analysis happens at each eluting slice, the payload is determined as a function of size. This is implemented in the Lipid Nanoparticle – Nucleic Acid (LNP-NA) Analysis module.
Learn more…
Particles and Number Density
It is possible to measure the size and number density of a sample with just a light scattering instrument. ASTRA supports several sophisticated models to determine the size of a macromolecule based solely on the angular variation in the light scattering intensity.
Learn more…
Molecular Conformation
The shape of molecules can be assessed from the molar mass and rms radius of the sample. Learn more…
Branching
ASTRA includes sophisticated branching calculations to assess the branching characteristics of a polymer sample. Learn more…
Viscometry
ASTRA provides several analysis features that take advantage of differential viscosity data acquired with a ViscoStar®. Determine Mark-Houwink-Sakurada terms, hydrodynamic radius, and more. Learn more…
Molar Mass via Conventional and Universal Calibration
Build a bridge between legacy conventional and universal calibration results and modern, accurate light scattering analysis. Learn more…
On-Line DLS
With one of the options for online DLS installed, you can extend your data analysis to determine the translational diffusion and corresponding hydrodynamic radius of your samples. Learn more…
DLS batch: Cumulants and Regularization
Determine translational diffusion and corresponding hydrodynamic radius of your unfractionated samples. Learn more…
Second Virial Coefficient (A2) Measurements
The second virial coefficient (A2) is a measure of macromolecular self-interaction and solute-solvent interactions, and is one of the few parameters that can be used to predict the crystallization properties of a protein. Learn more…
dn/dc and UV extinction coefficient determination
While dn/dc and UV extinction coefficients are documented for many existing compounds, they must be experimentally determined for novel samples. ASTRA provides analysis features to measure these critical sample characteristics. Learn more…
Absorption Correction
If a sample absorbs light at the MALS laser wavelength, molar mass calculations will be skewed. ASTRA uses the Forward Monitor detector signal (available in all Wyatt MALS instruments) to calculate the laser attenuation produced by sample absorption and correct the scattering signal levels. In this manner accurate molecular weights are ensured, even in the presence of absorption. Learn more...
Band Broadening Correction
ASTRA's robust band broadening correction accounts for interdetector dispersion effects to give you most accurate results possible. Learn more…
Baseline Subtraction
Certain analysis techniques, such as FFF or ion-exchange chromatography, cause large changes in refractive index and viscosity measurements as flow rates are modified during the run. This can make it difficult to properly analyze the file, as the RI and viscosity changes due to flow and pressure changes mask those caused by the sample. ASTRA provides a mechanism to subtract a data collection run without sample (a 'blank') from a sample run to reveal the sample-specific signal changes. Learn more…
Peak Statistics
Analyze the performance of your column and chromatography system with ASTRA’s built-in reports for column plate count, peak width and asymmetry factor. Learn more…
Error Analysis
Wyatt Technology software is written by scientists for scientists. ASTRA was designed from the ground up to properly compute and propagate uncertainties to ensure our results are publication-quality. Learn more…
Cutting Edge Technology
Wyatt Technology is committed to pushing macromolecular characterization to new levels. Consequently, we have a very strong program to develop intellectual property. Many of the algorithms in ASTRA are on the cutting edge of scientific analysis, and are either patented or have patents pending. See our Patents page for details.
State of the Art Reporting
Take control of your analysis reports with ASTRA's Report Designer. With just a few mouse clicks, adjust which data are displayed and how they are formatted. Add your own logo, incorporate some personal notes, or just pare down the default reports to focus on what you care about.
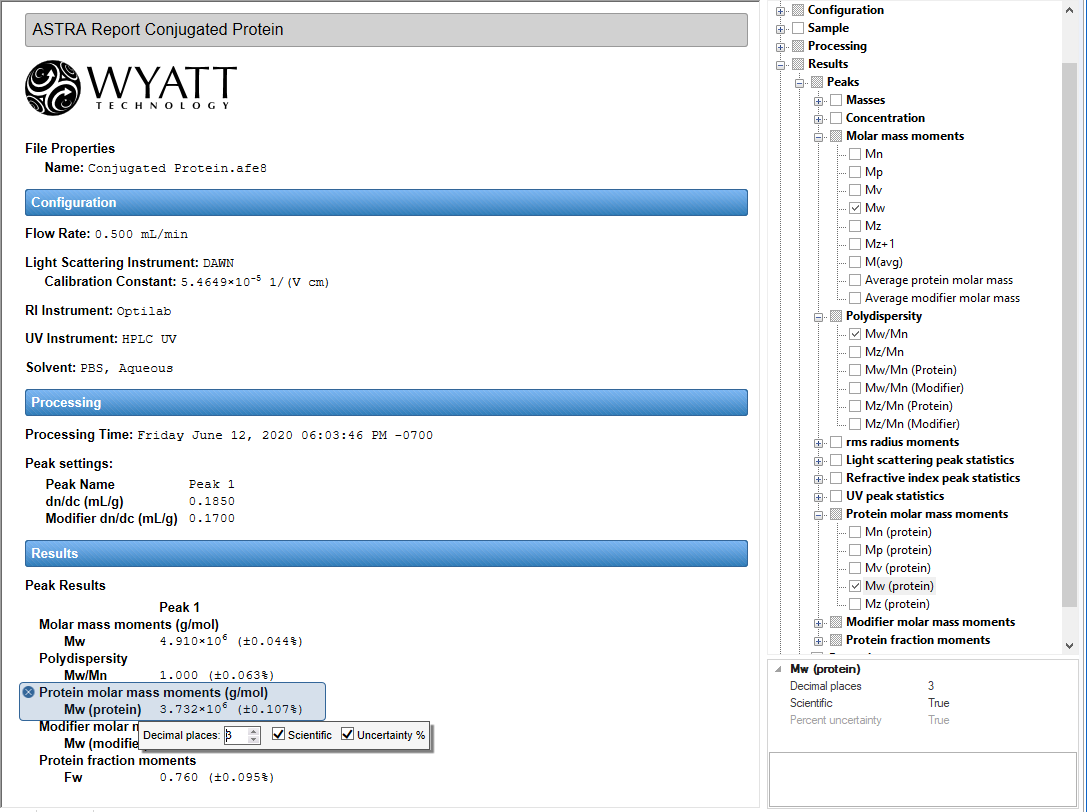
Customizable Logo and Summary
Personalize your reports.
In addition to the numerical and content selections provided in the Report Designer, ASTRA allows you to specify a logo image, and where it should be displayed. You can specify the title as well as additional summary information or notes that will appear on the report.
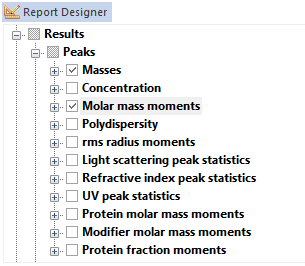
Personalized Data Selection
Choose your data. Choose your formatting.
Control the content and presentation of your reports with a few mouse clicks. Any bit of data generated during analysis is now available for you to incorporate into your report, with just a click of the mouse.
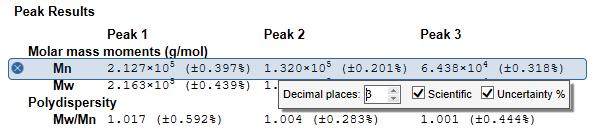
Full Numerical Formatting
Choose your display style and precision.
Click on a result, and ASTRA presents a simple, intuitive interface for controlling the numerical precision and display format of the result. Quickly and easily change results from fixed point to scientific notation, increase or decrease the number of significant digits to display, and determine if you wish uncertainties to be displayed as numerical values or percentages.
Built from the ground up to comply with 21 CFR Part 11, ASTRA with Security Pack makes compliance complete, along with IQ/OQ documents and procedures. Features are described below and more fully in the ASTRA Security Pack for 21 CFR (11) compliance White Paper.
Data Safety and Integrity
21 CFR Part 11 requires that electronic data be persistent, and that any changes to the data be recorded in an audit trail. ASTRA employs two methods to ensure this:
- All data and audit trails generated by ASTRA under Security Pack mode are stored in a secure, ODBC-compliant database. The database can be networked for automatic back-up by the IT department. This ensures that data will not be lost, and that any changes to the data will be associated with an audit trail in the same database.
- Encrypted checksums: Each entry in the database has an encrypted checksum. ASTRA uses this checksum to verify that the data being read from the database has not changed since it was last written, and notify the user of any data corruption or any attempt to alter the data.
User Security
In a compliant installation, system access is limited to authorized individuals. ASTRA with Security Pack leverages the Microsoft Windows security system to provide user authentication:
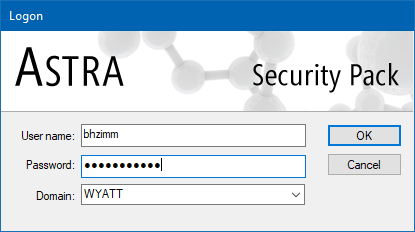
- Secure login - In order to run ASTRA with Security Pack enabled, users must enter a unique user ID and password. Logins, login attempts, and logouts are all recorded in the system audit trail.
- Microsoft Windows user accounts and groups are leveraged for security. System administrators create four specific security groups, then associate existing Microsoft Windows users with these groups. The Microsoft Windows user accounts are then used to log in.
- It is possible to set up the ASTRA or DYNAMICS security groups in the Active Directory, such that network-authenticated accounts can be given appropriate privileges. One domain-level user account can then be used to log in to any instance of ASTRA on the network.
Privilege levels
User accounts can have one of four privilege levels:
- Administrator - Administrators have rights to perform all actions, including changing database connections and deleting data.
- Researcher - Researchers can create and run new methods, change instrument configuration settings, and export and import data from the database.
- Technician - Technicians can only run predefined methods set up by a Researcher. Technicians can collect data and perform simple processing, but cannot change any configuration settings.
- Guest - Guests have read-only privileges to view audit trails and data.
Audit Trails
ASTRA provides two levels of audit trail to independently record all operator actions that create, modify, or delete electronic records. Each entry in the audit trail is time-stamped, and records the operator performing the actions, as well as the computer where the actions are performed. In the screen shot on the right, the general view of the system log is displayed, along with an experiment log.
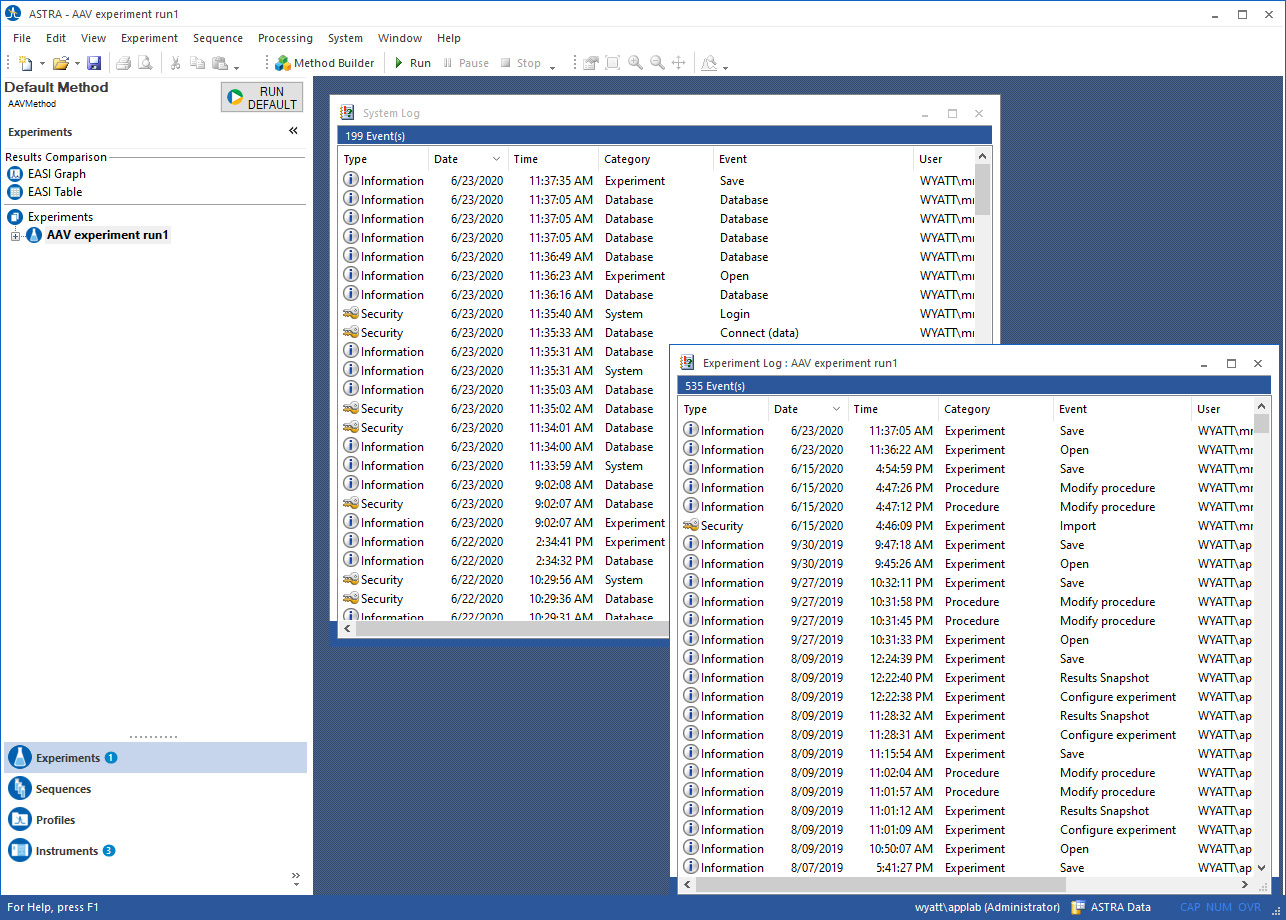
System log
The system log is always associated with the database where the data is stored. This audit trail cannot be separated from the data associated with it. The system log records actions such as:
- Logins, login attempts, and logouts
- Data creation, modification, and deletion
- Database connections and disconnections
- Import and export of data from the database
Experiment log
Each experiment has a separate log that records all actions within the experiment that affect the data. The experiment log is always with the experiment, and cannot be reset. The experiment log records actions such as:
- Changes to instrument configuration settings
- Changes to analysis methods
- Collection of data
- Electronic signatures executed to the experiment
- Changes in presentation methods
Electronic Signatures
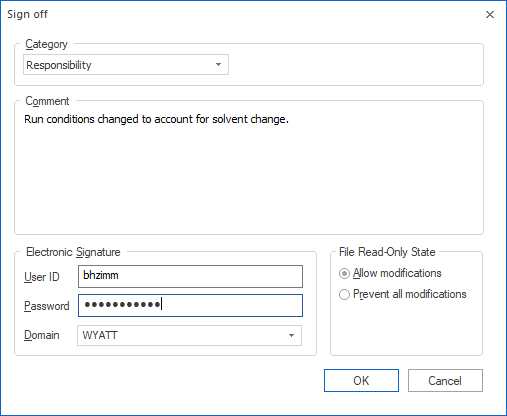
Electronic signatures can be executed on any data collected in ASTRA in Security Pack mode. To perform an electronic signature, the user first specifies a signature category (such as responsibility, approval, or review) and description, then enters a unique user ID and password. The electronic signature is executed to the experiment log associated with the data, and shows up in the report associated with the experiment.
Multiple electronic signatures can be executed to an experiment. In the reported results, the software flags any electronic signatures that were made before the last modification. If the file is locked while signing, any further modifications are prohibited in Dynamics. Failed electronic signature attempts are recorded in the system log with an alarm status for immediate notification of system administrators.
Enforcing Permitted Sequences
Ideally, a 21 CFR Part 11 compliant application should be usable for quality assurance in a manufacturing process. To meet this goal, it is necessary that the application support "operational system checks to enforce permitted sequencing of steps and events". In other words, it should be possible for a technician in quality assurance to run the application with minimal input and limited possibility to affect the results through incorrect decisions.
ASTRA SP has strong support for enforcing permitted sequences through the methods. A user with Researcher privilege level can create a new experiment, and then save it as a Method. A user with Technician privilege level can only use the Method to collect and analyze data, and cannot make changes to the Method configuration, analysis, or results reporting.
With the method technology, ASTRA supports moving macromolecular and nanoparticle characterization into everyday manufacturing and quality assurance applications.
Human Readable Records
All of the data that ASTRA generates are made available to the user in human readable form. Using powerful data export and presentation capabilities, all data can graphed, shown in tables, or exported to text. In addition, ASTRA reports are customizable to present the data of interest, and can be exported to PDF format.
Validation
Incoming Qualification and Operational Qualification documents are provided with ASTRA Security Pack, ensuring validation at the lab site.
In addition, Wyatt’s software products are completely validated products:
- All software development is executed under a formal quality system, using a standard software lifecycle model.
- Documented testing and traceability is performed to demonstrate accuracy, reliability, and consistent intended performance.
- The ability to discern altered or invalid records is built in.
We welcome audits of the software development and maintenance process by customers' qualified auditors.
Wyatt Software System Requirements
Please see Host Computer Requirements for details of the computer hardware and operating system required by ASTRA.