DYNAMICS™
Versatile software for size and charge measurements.DYNAMICS
Analyze size, molar mass, zeta potential, particle concentration and stability
DYNAMICS is a full-featured package for collecting, analyzing and reporting data acquired with one of Wyatt’s batch dynamic or electrophoretic light scattering instruments: DynaPro™ Plate Reader, DynaPro™ NanoStar™, DynaPro™ ZetaStar™ or Mobius™. It combines flexibility and intelligence with rigorous calculations that can be as seamless or fine-tuned as you choose.
Are the results real?
Too often DLS software is a black box. DYNAMICS automatically reviews every measurement for instant feedback on data quality with actionable advice, and also lets you review the raw data for deeper understanding.
Need a productivity boost?
Automate hundreds of measurements to assess stability across protein formulation space, time and temperature using the DynaPro Plate Reader, or automate just a few to check size and charge of the latest nanoparticle preps using the ZetaStar or Mobius with an autosampler. DYNAMICS software combined with HPLC CONNECT™ orchestrates the entire sequence.
Working in a regulated environment?
DYNAMICS offers an optional 21 CFR Part 11 compliant security and database package for use in GMP and GLP laboratories.
Essential answers
 Intuitive yet powerful, DYNAMICS helps you make the most of dynamic, static and electrophoretic light scattering (DLS, SLS and ELS).
Characterize particles from less than a nanometer to several microns in order to determine:
- Size and size distributions
- Particle concentration
- Stability
- Interactions
- Molar mass
- Turbidity or opalescence
- Zeta potential and molecular charge
DYNAMICS records and reports particle size according to ISO 22412 and ASTM 2490-09.
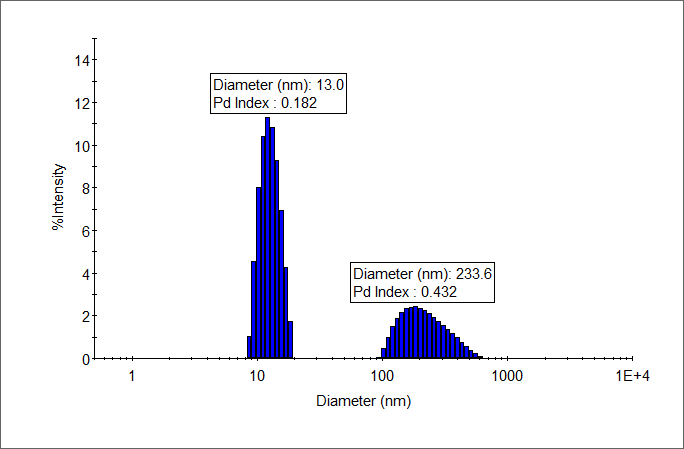
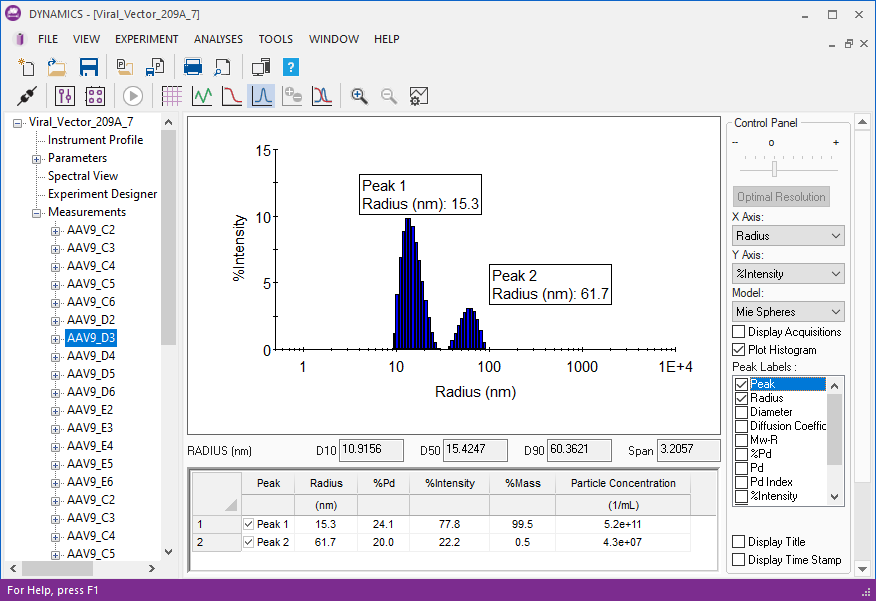
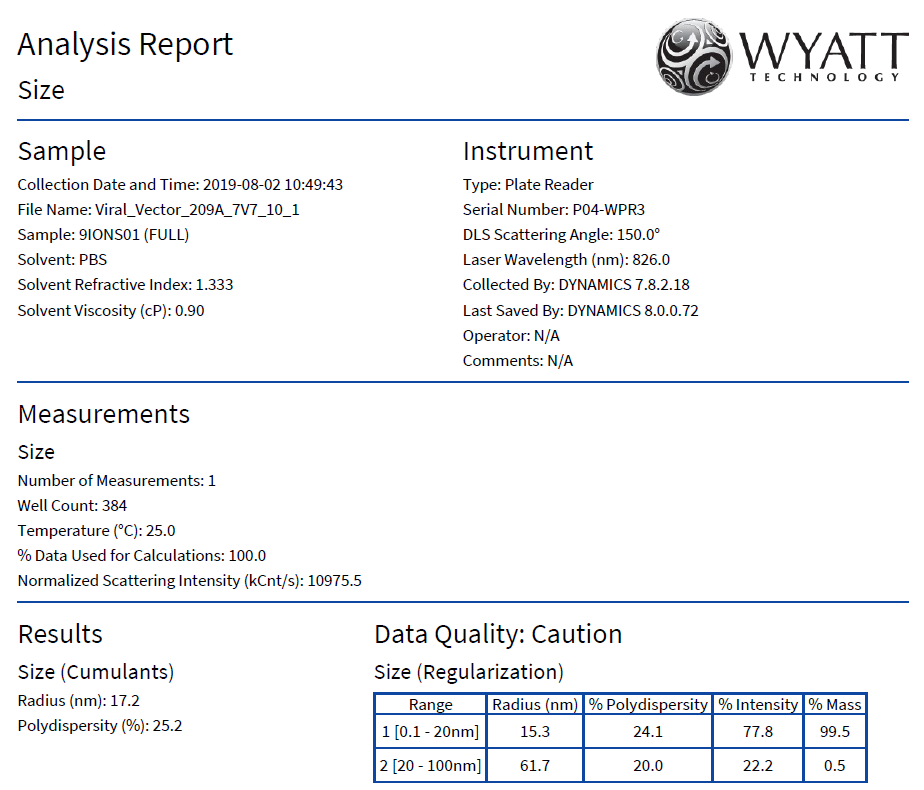
The Regularization graph shows size distributions determined by DLS. Click to enlarge.
Get organized
DYNAMICS provides a variety of formats for viewing and organizing results. Graphic representations of multiple measurements, for example size distributions, autocorrelation functions or zeta potential ‘V’ graphs may be overlaid for comparison, or viewed individually with a complete table of results. Results from any and all acquisitions recorded in the data file can be plotted against time, temperature, concentration, pH or other experimental parameters – even against other measured results, for example size versus zeta potential.
It’s always helpful to review graphs to understand experiments, but when it comes to actually making use of the output of a series of measurements, tables are invaluable for analyzing statistics, trends, data quality and repeatability. Tables in DYNAMICS are highly customizable so you can view just the relevant results, and export to a spreadsheet for further study.
The EASI Overlay feature is especially beneficial in that it allows comparing select graphs, viewing tables of results and exporting summaries, regardless of whether the underlying data come from the same or different data files or instruments. The EASI Overlay Datalog graph can be quickly set up to show two results on the y axes, like size and polydispersity, against any experimental parameter.
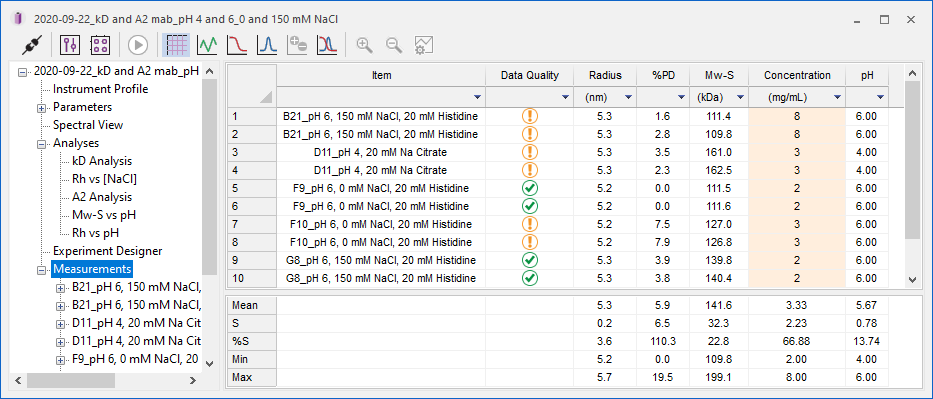
The data table in DYNAMICS pulls together all aspects of every measurement in the current experiment. The table is fully sortable and customizable, and may be exported to a spreadsheet. Click to enlarge.
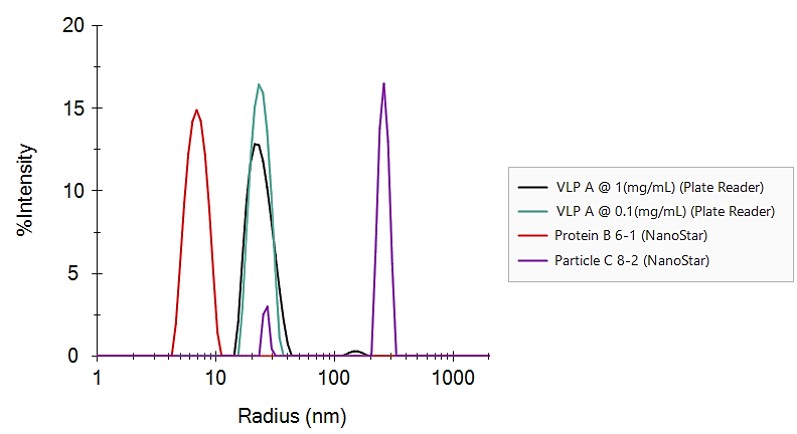
The EASI overlay feature in DYNAMICS provides for comparing the results of different experiments, performed on different days and even on different DynaPro instruments. Click to enlarge.
Ready for results
Simply turn on the instrument, open one of the experiment presets (SOPs) corresponding to common types of measurements, and start recording. Data are stored, analyzed and presented in real time. For maximum flexibility, DYNAMICS lets you customize presets to meet specific requirements and workflows.
High-throughput experimentation
The Experiment Designer offers an intuitive, guided workflow to set up plate scans in the DynaPro Plate Reader. Easily design isothermal or temperature scans for entire well plates or just a few specific wells.
Measurement automation
Need even more flexibility? Program sophisticated methods into DYNAMICS using the Event Scheduler scripting feature, with specific functions for DynaPro Plate Reader, ZetaStar, Mobius and NanoStar.
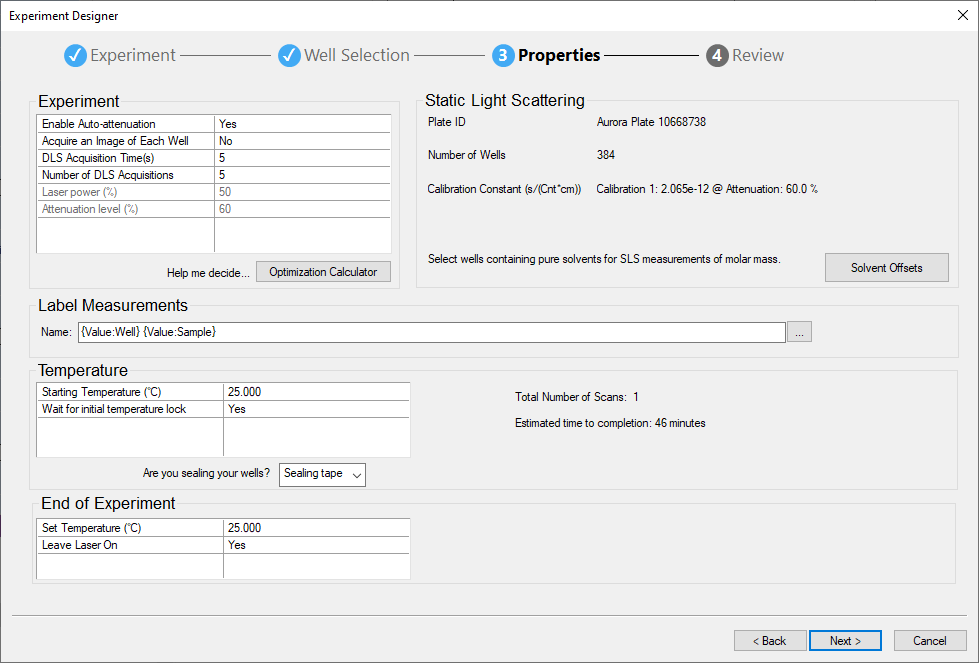
The Experiment Designer makes programming plate scans as easy as 1-2-3. Click to enlarge.
Autosampler delivery
Too busy to stand around making manual size and zeta potential measurements? ZetaStar or Mobius combined with a pump and autosampler to automate an entire set of samples. DYNAMICS combined with HPLC CONNECT software allows for a full digital synchronization to make autosampler methods as easy as 1-2-3.
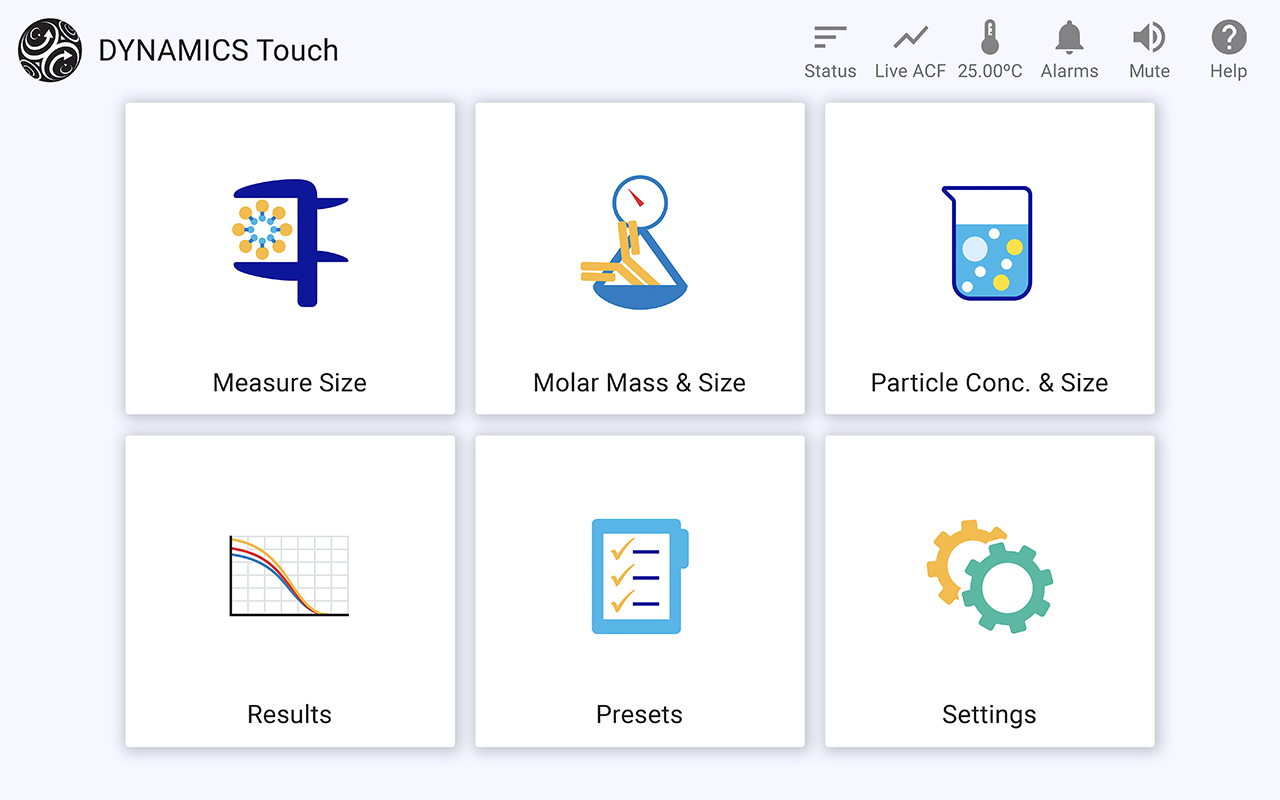
DYNAMICS Touch™ Integration
The unique DYNAMICS Touch, on board the DynaPro NanoStar and the ZetaStar, guides walk-up users through basic DLS/SLS measurements. Data files generated with DYNAMIC Touch may be read into DYNAMICS for advanced analysis. You can open and merge one or more DYNAMICS Touch experiments to compare and identify trends using the extended characterization tools in DYNAMICS. You can also upload cuvette definitions to DYNAMICS Touch directly from DYNAMICS.
Versatile Analysis
Essential analytics, advanced capabilities
There’s more to your data than size and zeta potential: DYNAMICS can analyze a data set in many ways, to evaluate temperature stability, protein-protein interactions or critical micelle concentration, and even plot any sample parameter vs. another. With built-in capability for static light scattering measurements, both NanoStar and Plate Reader support particle concentration and molar mass measurements. Explore the power of DYNAMICS below.
Size and Size Distributions
Comprehensive analysis of DLS data with industry-standard and advanced algorithms for cumulants and regularization, plus cumulative size distributions. Learn more…
Molar Mass (MW)
A powerful combination: Absolute molecular weight of a macromolecular solution by SLS, and size measured simultaneously by DLS. Learn more…
Zeta Potential and Charge
Determine charge of nanoparticles, colloids or proteins for different pH or salt conditions; and predict stability. Learn more…
Particle Concentration
Harness the power of static and dynamic light scattering to determine the concentration of lipid nanoparticles, viruses, virus-like particles and more. Available for cumulants and regularization analysis. Learn more…
Thermal Stability
Monitor protein melting/unfolding or investigate thermo-responsive polymers and colloids. DYNAMICS determines transition temperatures
Tonset, Tagg and Tm, as well as average size at transition points. Learn more…
![]()
Protein Colloidal Stability
Built-in analysis to quantify non-specific protein-protein interactions via the diffusion interaction parameter kD and second virial coefficient A2. Learn more…
Concentration Analysis
Determine the Critical Micelle Concentration (CMC) and other concentration dependent size changes with Concentration Dependence analysis. Learn more…
Parametric Analysis
There are no limitations when it comes to analyzing trends for your samples: Analyze any transition with the Custom Parametric Analysis. Plot radius versus pH, molar mass versus salt concentration or select any custom pair of parameters. Learn more…
Viscosity
Add a tracer particle of known size to determine solution viscosity for high-concentration protein formulations. Learn more…
Turbidity
Using a turbidity calibration plot, determine turbidity or opalescence to optimize formulations. Learn more…
Data quality, with every measurement
It's easy to get lost in the numbers. That's why DYNAMICS includes a data quality report for every measurement, indicating if measurements are good, should be inspected more closely or require additional sample preparation and measurements. You get practical advice on how to improve data and sample quality.
Intelligent simplicity, robust results
DYNAMICS provides a suite of filters to cull sub-par acquisitions and retain only good measurements, according to quantitative criteria. This eliminates the need to groom large data sets manually, yet provides highly reliable results.
For advanced users, DYNAMICS offers access to all raw data. Assess any acquisition and decide whether to retain or discard – and reset your filters any time.
Name your sample
When you run lots and lots of measurements, keeping track can be tricky. DYNAMICS can automatically add any parameter or setting to the measurement name, at time of data acquisition or post-collection. This even works for custom parameters and results!

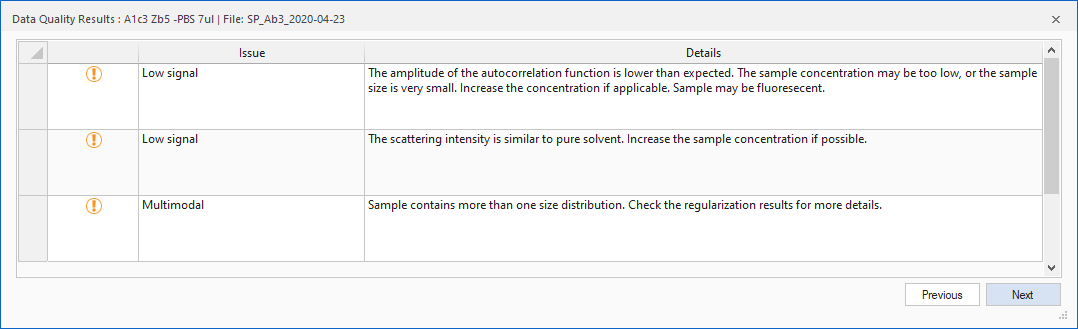
The data quality report provides insight into the causes of, and remedies for, sub-par data. Click to enlarge.
Customize it, your way
Units, digits of precision, colors, fonts – you have control. Even the call-out labels of peaks in the size distribution graph can be modified to display the information you need. Save your selection as a preset (SOP) so the same settings apply each time you run the same type of measurement.
Custom parameters, such as pH, incubation time, sample preparation or simply text comments may be assigned to each sample. These custom parameters become part of the data table for convenient display and editing.
Sort and filter
Sort on any column in the data table or filter out selected data to view and perform analysis only on the samples you need. Statistical analysis of the filtered data set is automatically calculated.
Document your results
For easy viewing and reporting, DYNAMICS offers compact, pre-set single-page reports containing only the essential results. In addition, you can fully customize extended reports to document exactly the information you need.
Export with a click
Export graphs and tabulated data with a single mouse click: the data underlying any graph or graph overlay can be saved to .csv format, while graph images can be copied or saved to .jpg or .emf formats for pasting into your presentation or document. For the results table you can choose to export the table displayed in the software or the full set of parameters and results for further analysis.
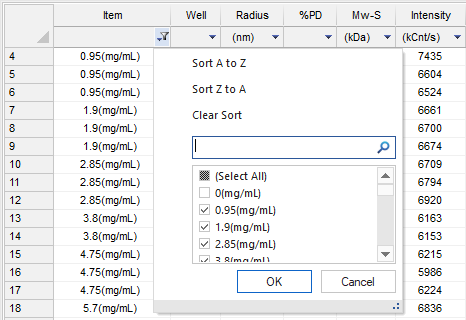
The data table may be sorted on any column. Click to enlarge.
A simple single-page report presents the most commonly needed information in a click. Click to enlarge.
Regulatory compliance and standards
DYNAMICS offers an optional 21 CFR Part 11 compliance package, including IQ/OQ documents and procedures, which are described below and more fully in the
DYNAMICS Security Pack 21 CFR Part 11 White Paper.
Data Safety and Integrity
21 CFR Part 11 requires that electronic data be persistent, and that any changes to the data be recorded in an audit trail. DYNAMICS employs two methods to ensure this:
- All data and audit trails generated by DYNAMICS under Security Pack mode are stored in a secure, ODBC-compliant database. The database can be networked for automatic back-up by the IT department. This ensures that data will not be lost, and that any changes to the data will be associated with an audit trail in the same database.
- Encrypted checksums: Each entry in the database has an encrypted checksum. DYNAMICS uses this checksum to verify that the data being read from the database has not changed since it was last written, and notify the user of any data corruption or any attempt to alter the data.
User Security
In a compliant installation, system access is limited to authorized individuals. Wyatt software leverages the Microsoft Windows security system to provide user authentication:
- Secure login - In order to run DYNAMICS with Security Pack enabled, users must enter a unique user ID and password. Logins, login attempts, and logouts are all recorded in the system audit trail.
- Microsoft Windows user accounts and groups are leveraged for security. System administrators create four specific security groups, then associate existing Microsoft Windows users with these groups. The Microsoft Windows user accounts are then used to log in.
- It is possible to set up DYNAMICS security groups in the Active Directory, such that network-authenticated accounts can be given appropriate privileges. One domain-level user account can then be used to log in to any instance of DYNAMICS on the network.
Privilege levels
User accounts can have one of four privilege levels:
- Administrator - Administrators have rights to perform all actions, including changing database connections and deleting data.
- Researcher - Researchers can create and run new methods, change instrument configuration settings, and export and import data from the database.
- Technician - Technicians can only run predefined methods set up by a Researcher. Technicians can collect data and perform simple processing, but cannot change any configuration settings.
- Guest - Guests have read-only privileges to view audit trails and data.
Audit Trails
DYNAMICS provide two levels of audit trail to independently record all operator actions that create, modify, or delete electronic records. Each entry in the audit trail is time-stamped, and records the operator performing the actions, as well as the computer where the actions are performed.
System log
The system log is always associated with the database where the data is stored. This audit trail cannot be separated from the data associated with it. The system log records actions such as:
- Logins, login attempts, and logouts
- Data creation, modification, and deletion
- Database connections and disconnections
- Import and export of data from the database
Experiment log
Each experiment has a separate log that records all actions within the experiment that affect the data. The experiment log is always with the experiment, and cannot be reset. The experiment log records actions such as:
- Changes to instrument configuration settings
- Changes to analysis methods
- Collection of data
- Electronic signatures executed to the experiment
- Changes in presentation methods
Electronic Signatures
Electronic signatures can be executed on any data collected in DYNAMICS under Security Pack mode. To perform an electronic signature, the user first specifies a signature category (such as responsibility, approval, or review) and description, then enters a unique user ID and password. The electronic signature is executed to the experiment log associated with the data, and shows up in the report associated with the experiment.
Multiple electronic signatures can be executed to an experiment. In the reported results, the software flags any electronic signatures that were made before the last modification. If the file is locked while signing, any further modifications are prohibited in Dynamics. Failed electronic signature attempts are recorded in the system log with an alarm status for immediate notification of system administrators.
Enforcing Permitted Sequences
Ideally, a 21 CFR Part 11 compliant application should be usable for quality assurance in a manufacturing process. To meet this goal, it is necessary that the application support "operational system checks to enforce permitted sequencing of steps and events". In other words, it should be possible for a technician in quality assurance to run the application with minimal input and limited possibility to affect the results through incorrect decisions.
DYNAMICS SP has strong support for enforcing permitted sequences through methods ('presets' in DYNAMICS). A user with Researcher privilege level can create a new experiment, and then save it as a Preset. A user with Technician privilege level can only use the Preset to collect and analyze data, and cannot make changes to the Preset configuration, analysis, or results reporting.
With preset technology, DYNAMICS supports moving macromolecular and nanoparticle characterization into everyday manufacturing and quality assurance applications.
Human Readable Records
All data that DYNAMICS generates are made available to the user in human readable form. Using powerful data export and presentation capabilities, all data can graphed, shown in tables, or exported to text.
Validation
Incoming Qualification and Operational Qualification documents are provided with DYNAMICS Security Packs, ensuring validation at the lab site.
In addition, Wyatt’s software products are completely validated products:
- All software development is executed under a formal quality system, using a standard software lifecycle model.
- Documented testing and traceability is performed to demonstrate accuracy, reliability, and consistent intended performance.
- The ability to discern altered or invalid records is built in.
We welcome audits of the software development and maintenance process by customers' qualified auditors.
Wyatt Software System Requirements
Please see Host Computer Requirements for details of the computer hardware and operating system required by DYNAMICS.