DYNAMICS™ Benefits
Size and Size Distributions
Molar Mass (MW)
Zeta Potential and Charge
Particle Concentration
Thermal Stability
Concentration Dependence
Concentration Analysis
Parametric Analysis
Viscosity Calculations
Turbidity or Opalescence
REQUEST INFO
Size and size distributions – the basics
Report the average size as radius, diameter or diffusion coefficient, and the peak width as polydispersity, percent polydispersity or polydispersity index (PDI), all measured by DLS.
The method of cumulants determines the average size and polydispersity. DYNAMICS reports particle size according to the cumulants algorithm specified in ISO 22412 and ASTM 2490-09. Alternatively, choose a proprietary cumulants calculation for advanced fitting.
A sample with high polydispersity indicates the presence of aggregates or multiple species. Regularization, a non-negative least squares (NNLS) fitting algorithm, resolves populations that are different by a factor of 3-5 in size. Distributions may be calculated and displayed in terms of %Intensity, %Mass or %Number distributions.
For a broad size distribution, it is important to understand the entire distribution rather than the mean radius alone. DYNAMICS provides calculation of cumulative size distribution (either diameter or radius), with values for D10, D50 and D90 (the size of the sample below 10%, 50% and 90% of the entire distribution, respectively). The width of the distribution, defined as (D90-D10)/D50, is calculated as well.
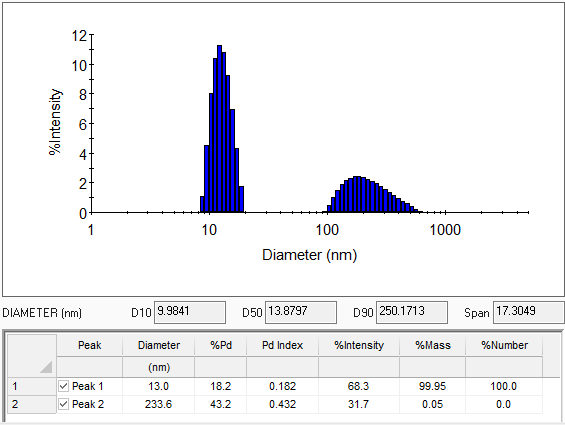
The Regularization graph displays size distributions as well as details of the individual populations and D10/D50/D90 parameters. Click to enlarge.
Molar mass by static light scattering
Measure the absolute molar mass (molecular weight) of proteins and small polymers in your DynaPro™ Plate Reader, DynaPro™ NanoStar™ or DynaPro™ ZetaStar™ simultaneously with DLS.
The combination of molar mass and size measurements, made simultaneously, determines molecular conformation and may distinguish between size changes due to protein unfolding and aggregation.
The graph shows an example of protein unfolding. The radius as measured by DLS changes from 2 to 2.6 nm. The constant molar mass and polydispersity (%PD) from 40 to 85 °C indicate that the size increase upon heating is due to unfolding and not aggregation.
For measurements of the absolute molar mass distribution or high-molecular weight polymers, we recommend the use of our multi-angle light scattering instruments coupled to size-exclusion chromatography, SEC-MALS.
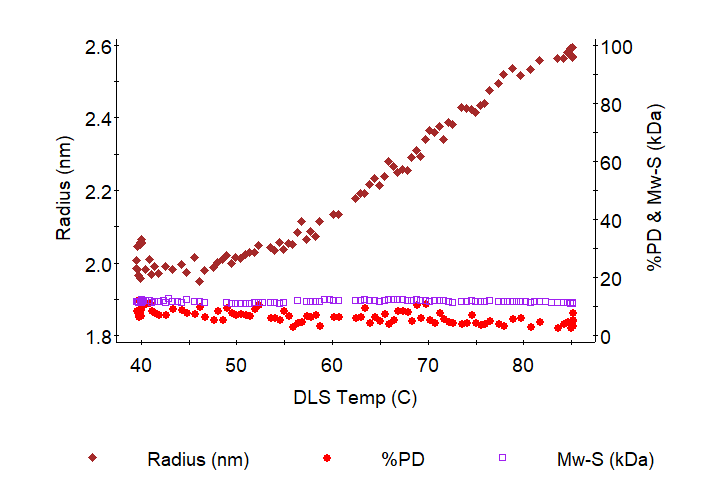
Temperature dependence of hydrodynamic radius, molar mass and %polydispersity, overlaid. Increasing size with constant molar mass indicates protein unfolding. Click to enlarge.
Zeta potential and charge
In electrophoretic light scattering, DYNAMICS doesn’t hold anything back. It supports the most common models - Henry, Hückel and Smoluchowski - to calculate zeta potential according to sample and solution conditions.
In combination with Rh from DLS (measured simultaneously), the net and effective charge on a particle are also calculated.
In addition, DYNAMICS reports conductivity, Debye length and the value of Henry’s function.
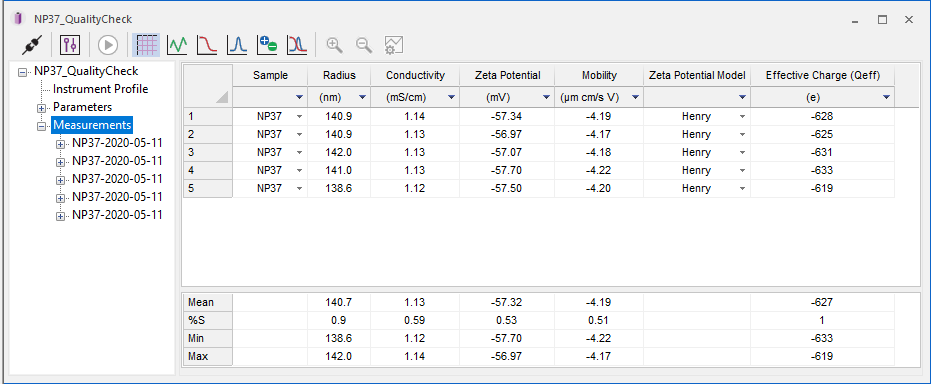
The data table for an electrophoretic light scattering measurement provides a complete set of analyses plus statistics across the acquisitions. Click to enlarge.
Particle Concentration
The number of particles per mL is a critical piece of information in developing nanoparticles for therapeutic, diagnostic and other uses. DYNAMICS calculates particle concentration by combining DLS and SLS: dynamic light scattering determines particle size, which—combined with the material's refractive index and the total scattered intensity—is sufficient to quantify concentration.
As shown in the example, a few microliters of sample and a few seconds of measuring time suffice to determine particle size and concentration of both monomers and aggregates of an adeno-associated virus. It is easy to test multiple serotypes, evaluate process parameters or assess stability in storage buffers.
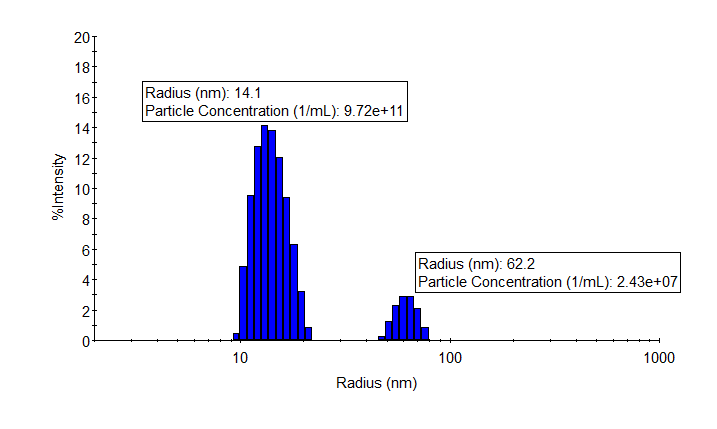
Analysis of an AAV reveals the size and concentration of the primary and aggregated populations. Click to enlarge.
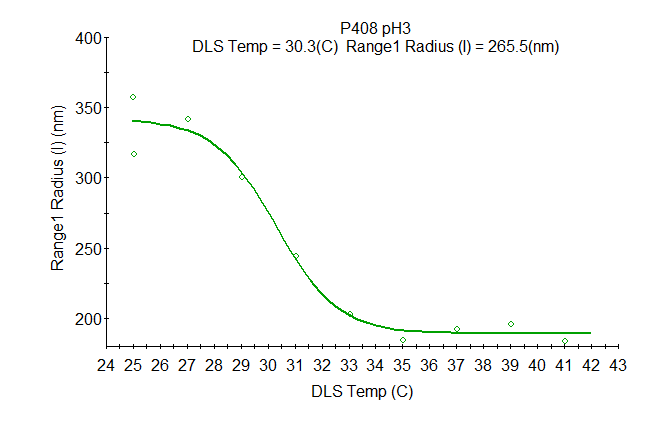
Thermal stability – melting, aggregation, unfolding
Monitor protein melting and unfolding, determine the critical micelle temperature (CMT) or investigate thermo-responsive polymers and colloids. DYNAMICS determines transition temperatures Tonset, Tagg and Tm, as well as average size at the transition point.
Every molecule behaves differently. That's why DYNAMICS provides analysis in terms of the onset transition temperature for aggregating samples, sigmoid (midpoint) conformation changes such as protein unfolding, and polynomial analysis for anything else.
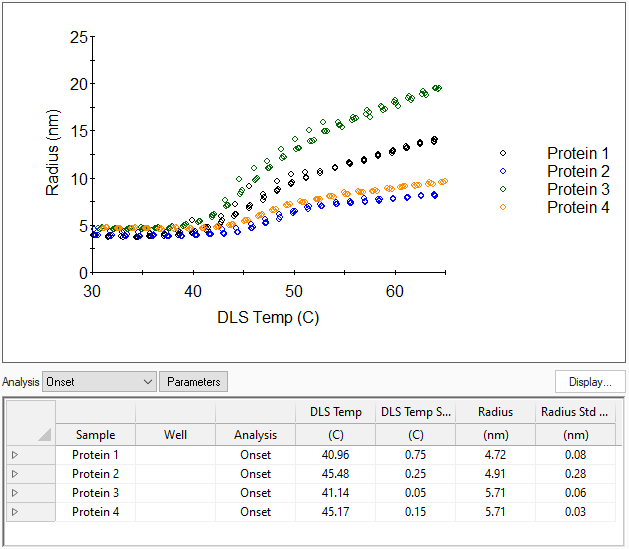
The initial size, final size and onset temperature of aggregation depends dramatically on protein formulation. The entire set of conditions is easily measured in one run on the DynaPro Plate Reader. Click to enlarge.
Colloidal stability – measure non-specific interactions
Non-specific protein-protein interactions are key for selecting biotherapeutic candidates such as IgG and optimizing their formulation.
By measuring and analyzing a concentration series, both A2 (from static light scattering) and kD (from dynamic light scattering) may be determined.
This example shows the kD analysis of an antibody formulation in different buffer and salt conditions. The positive values for kD indicate formulation stability.
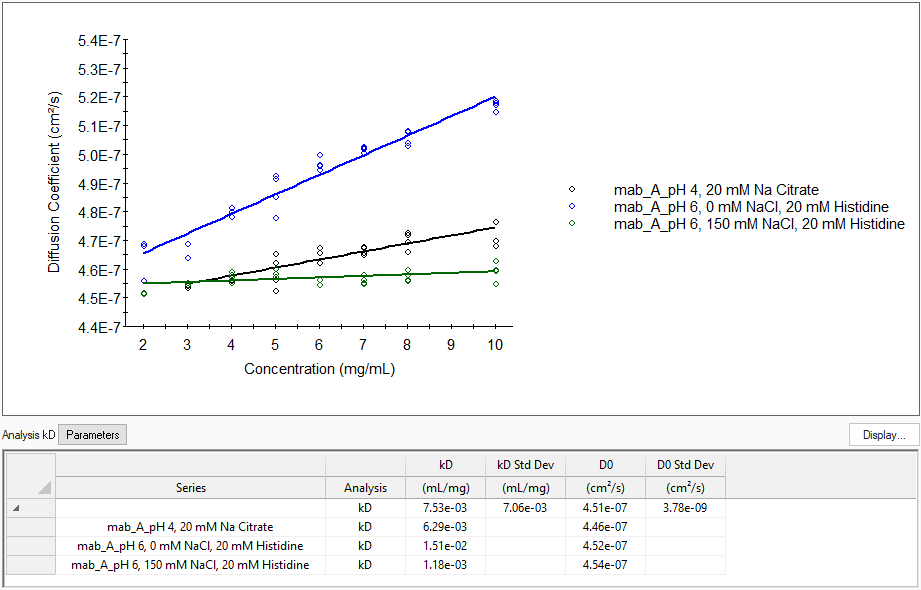
It’s easy to evaluate colloidal stability of a monoclonal antibody under different formulation by setting up a series of concentrations and conditions in a well plate, utilizing a single scan in the DynaPro Plate Reader and DYNAMICS. Click to enlarge.
Concentration analysis
Determine the critical micelle concentration (CMC) and other concentration-dependent size changes with DYNAMICS’s Concentration Dependence analysis.
The example shows the concentration dependence size for an amphiphilic polymer. Each concentration was measured in triplicate in the DynaPro Plate Reader. The CMC, defined as the midpoint of the transition, is 0.04 mg/mL with a radius 1.7 nm.
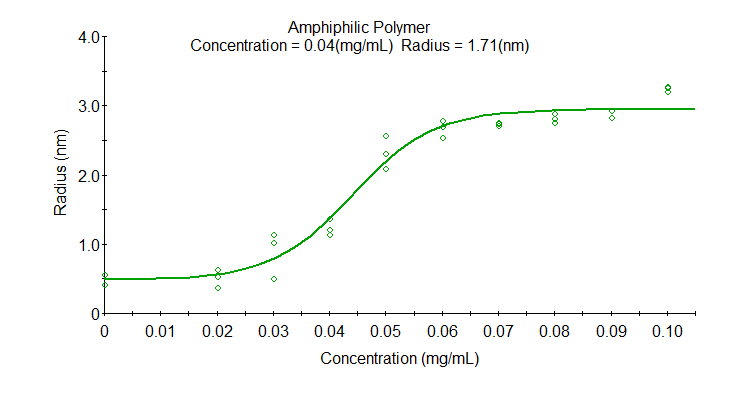
Dynamic light scattering uses a meaningful biophysical parameter – size – to determine the critical micelle concentration. Click to enlarge.
Parametric analysis for every need
There are no limitations when it comes to analyzing trends for your samples: Analyze any transition with the Custom Parametric Analysis. Select parameter pairs such as radius versus pH or zeta potential versus salt concentration. Thermo-responsive polymers may be analyzed as shown in the graph.
DYNAMICS lets you plot any measured parameter against any other parameter, whether independent or measured. Click to enlarge.
Viscosity calculations
Solution viscosity of high-concentration protein formulations is determined by measuring the diffusion of a tracer particle of known size. In DYNAMICS, simply specify the hydrodynamic radius of the standard size particle (250 nm in this example), set Viscosity Calculation to ‘Use Internal Standard’ and the viscosity of the formulation will be calculated and displayed in the data table.
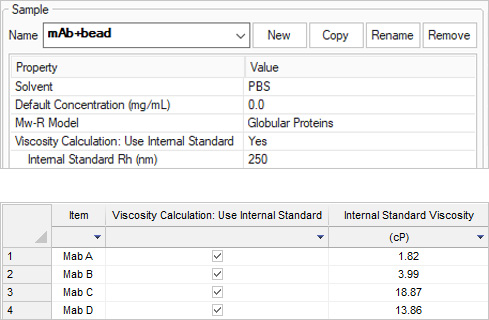
Viscosity analysis by DLS uses the diffusion of particles of a known size, which is entered in the sample definition (top). Results appear in the data table (bottom). Click to enlarge.
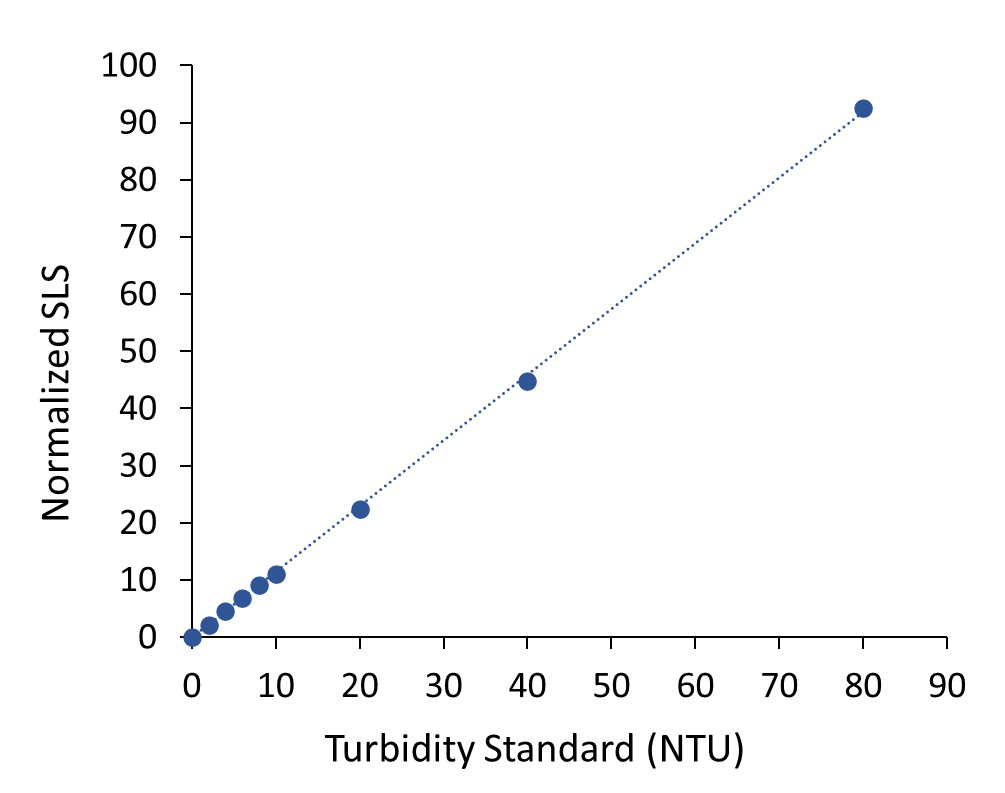
Turbidity or Opalescence
Opalescence of a formulation or turbidity of a solution is determined interpolated from a turbidity calibration plot. A quartz cuvette is calibrated against a series of turbidity standards, and the turbidity of a solution subsequently measured in that cuvette is calculated and displayed in the data table in nephelometric units (NTU).
Visit the turbidity/opalescence page to learn more.