How do I use the Viral Vector Analysis in ASTRA™ 8?

Introduction
The Viral Vector Analysis procedure in the ASTRA 8 software calculates attributes of viral vectors comprised of a protein capsid and encapsulated DNA payload, such as an adeno-associated virus (AAV) vector. The method requires a light scattering detector in conjunction with two concentration detectors that have differing responses to protein and nucleic acid constituents. This can be accomplished with either a UV and RI detector or two different UV wavelengths from a single device, such as 280 nm and 260 nm. HPLC CONNECT™ and its native support for recording digital UV data make it easy to capture multiple UV wavelengths and perform this calculation with two UV signals.
ASTRA’s Method Builder wizard makes it easy to build a Viral Vector Method in 3 steps.
Step 1
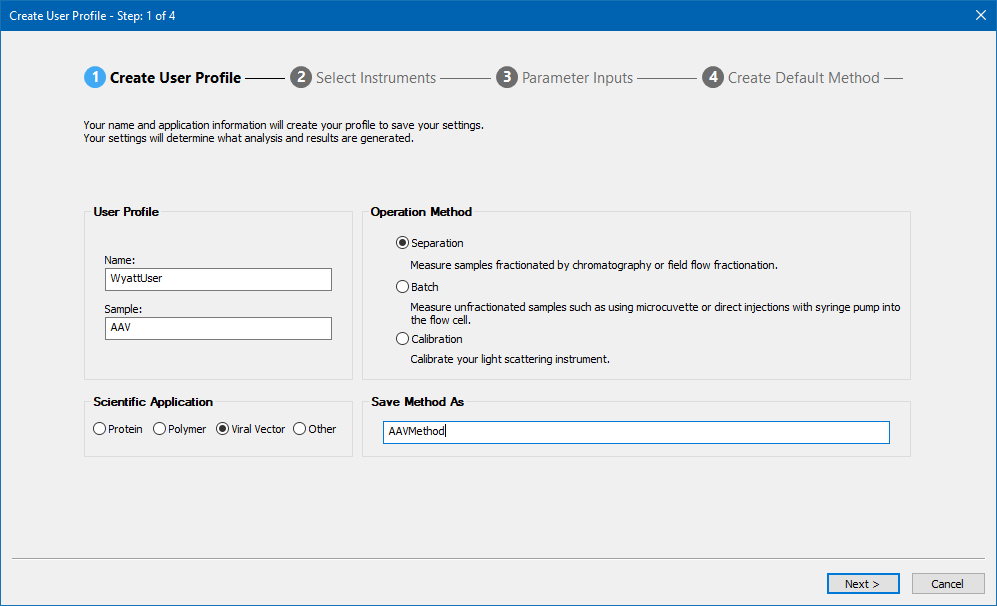
Step 1: Choose Viral Vector as the Scientific Application.
Step 2
Step 2: Select your instruments. If you have HPLC CONNECT you can choose to import a digital signal by choosing “Digital UV” in the dropdown box. The Method Builder allows you to select up to two UV signals and wavelengths to be imported. To specify additional wavelengths to collect, add them to the configuration of an experiment created from your method and then save the experiment as a method prior to collection.

Step 3
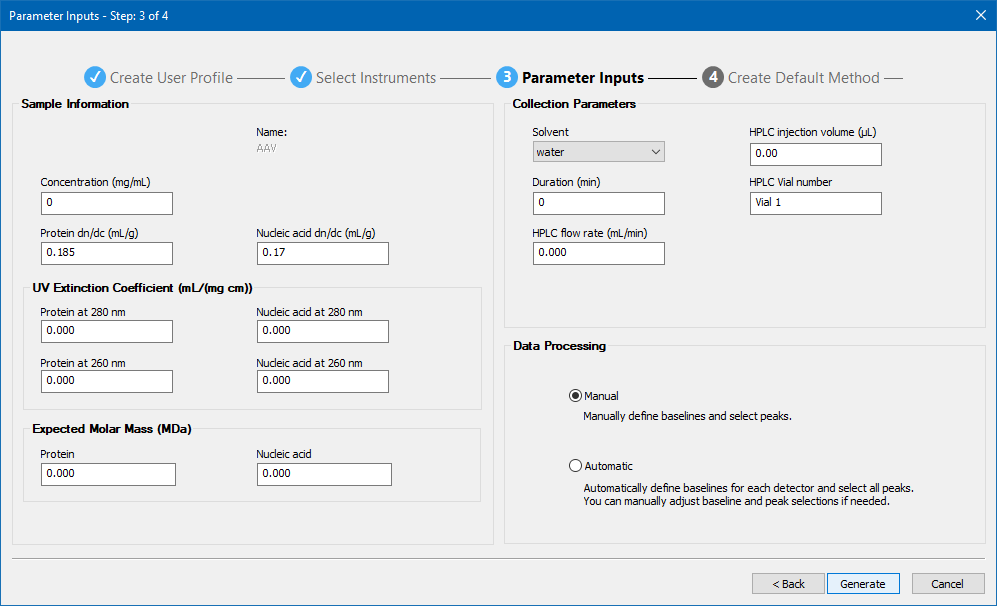
Step 3: Enter in the parameters of your method. For information about how to obtain the correct parameters and conditions for Viral Vector Analysis contact Wyatt Support.
Viral Vector Analysis
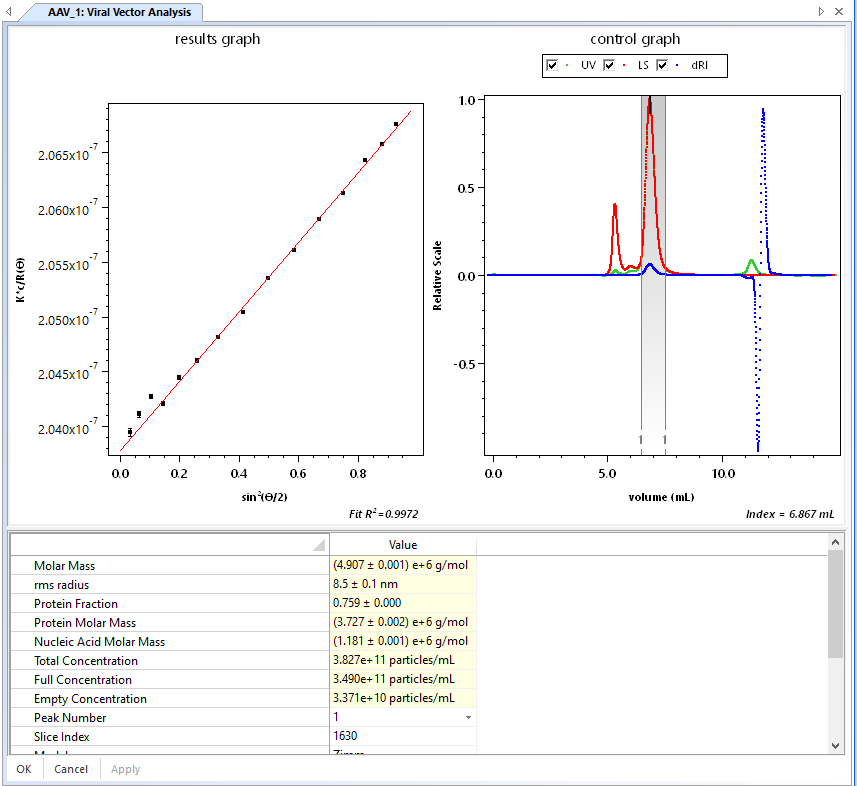
Once you’ve run your method, the Viral Vector Analysis in your experiment allows you to see the slice-by-slice protein molar mass, nucleic acid molar mass, and viral particle concentrations including full and empty capsid concentrations.
Multiple Concentration Sources
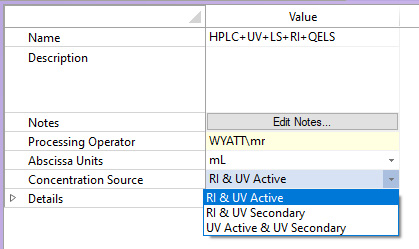
If your data included an RI signal and two or more UV wavelengths, you can compare results from the three calculations without changing any sample or peak parameters by selecting the concentration sources from the experiment configuration.
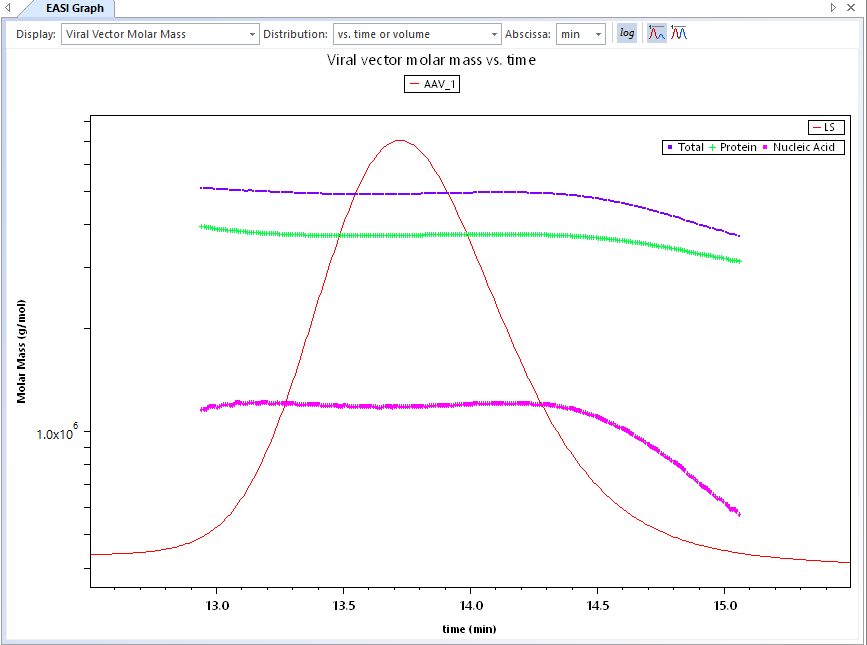
EASI Graph
EASI Graph will display the total molar mass as well as the mass of the protein capsid and DNA payload.
Conclusion
To learn more about what you can do with the Viral Vector Analysis procedure and ASTRA 8, login to our Support Center for resources including technical notes, User Meeting presentations, and the ASTRA 8 User’s Guide.
Do you have a question? Contact our experts here in Customer Support. We’re happy to help! Call +1 (805) 681-9009 option 4.